


Gold slips as Trump’s Iran warning lifts US Dollar
- Gold’s next catalyst is jobless claims report.
- Trump says Iran deal is over, reigniting war-premium fears.
- Rising Oil and Treasury yields pressure non-yielding bullion.
Gold (XAU/USD) price dives over 1.30% on Wednesday as tensions in the Middle East bolstered the Greenback after US President Donald Trump said that the agreement to end the war with Iran was “over.” At the time of writing, XAU/USD trades at $4,059 after hitting a four-day low of $4,021.
XAU/USD falls as Oil spike revives Fed tightening risks
The yellow metal is feeling the strength of the US Dollar (USD) and also of rising US Treasury yields. US President Trump’s doubts about making a deal with Iran increased the chances of a resumption of attacks, exerting pressure on Oil prices.
Western Texas Intermediate (WTI), the US crude Oil benchmark, gains over 3%, with the barrel quoting at $74.50 at the time of writing. This boosted the Greenback as high energy prices pose the risk of high inflation, fueling bets for higher interest rates. The US Dollar Index (DXY), which tracks the buck’s performance against six currencies, is up 0.10% at 101.20.
US Treasury yields are up, with the 10-year T-note rising almost 8.5 basis points, yielding 4.589%, a headwind for the non-yielding metal.
The swaps markets have priced in 27 basis points of Federal Reserve (Fed) tightening by the end of the year. Nonetheless, for the July meeting, traders expect the Fed to hold rates, as odds are at 65% versus a slim 35% chance of a rate hike, according to Prime Terminal.
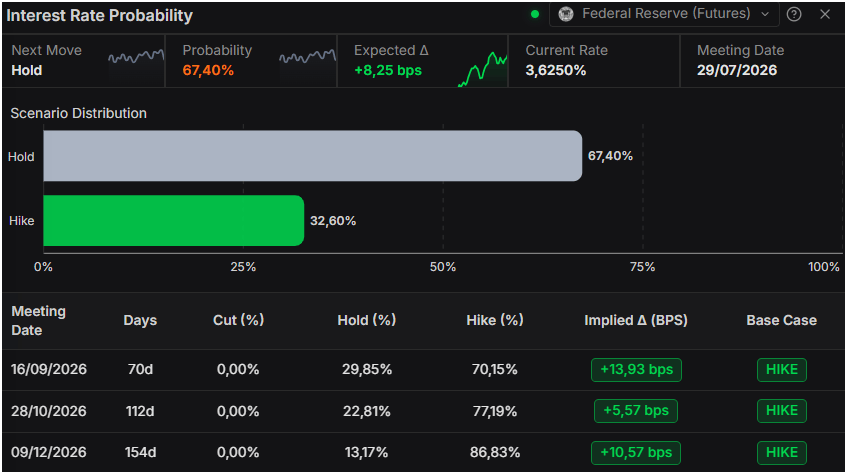
Traders will next watch for the release of the Fed’s last meeting minutes, the first led by Kevin Warsh. On Thursday, the US economic calendar includes the release of Initial Jobless Claims for the week ending July 4.
Wall Street Banks adjust their Gold forecasts
Bank of America lowered its 2026 Gold price forecast by 14% to $4,360 due to a hawkish Fed but still sees $5,000 as attainable after the tightening cycle.
XAU/USD price forecast: Gold price remains bearish, eyes on $4,000
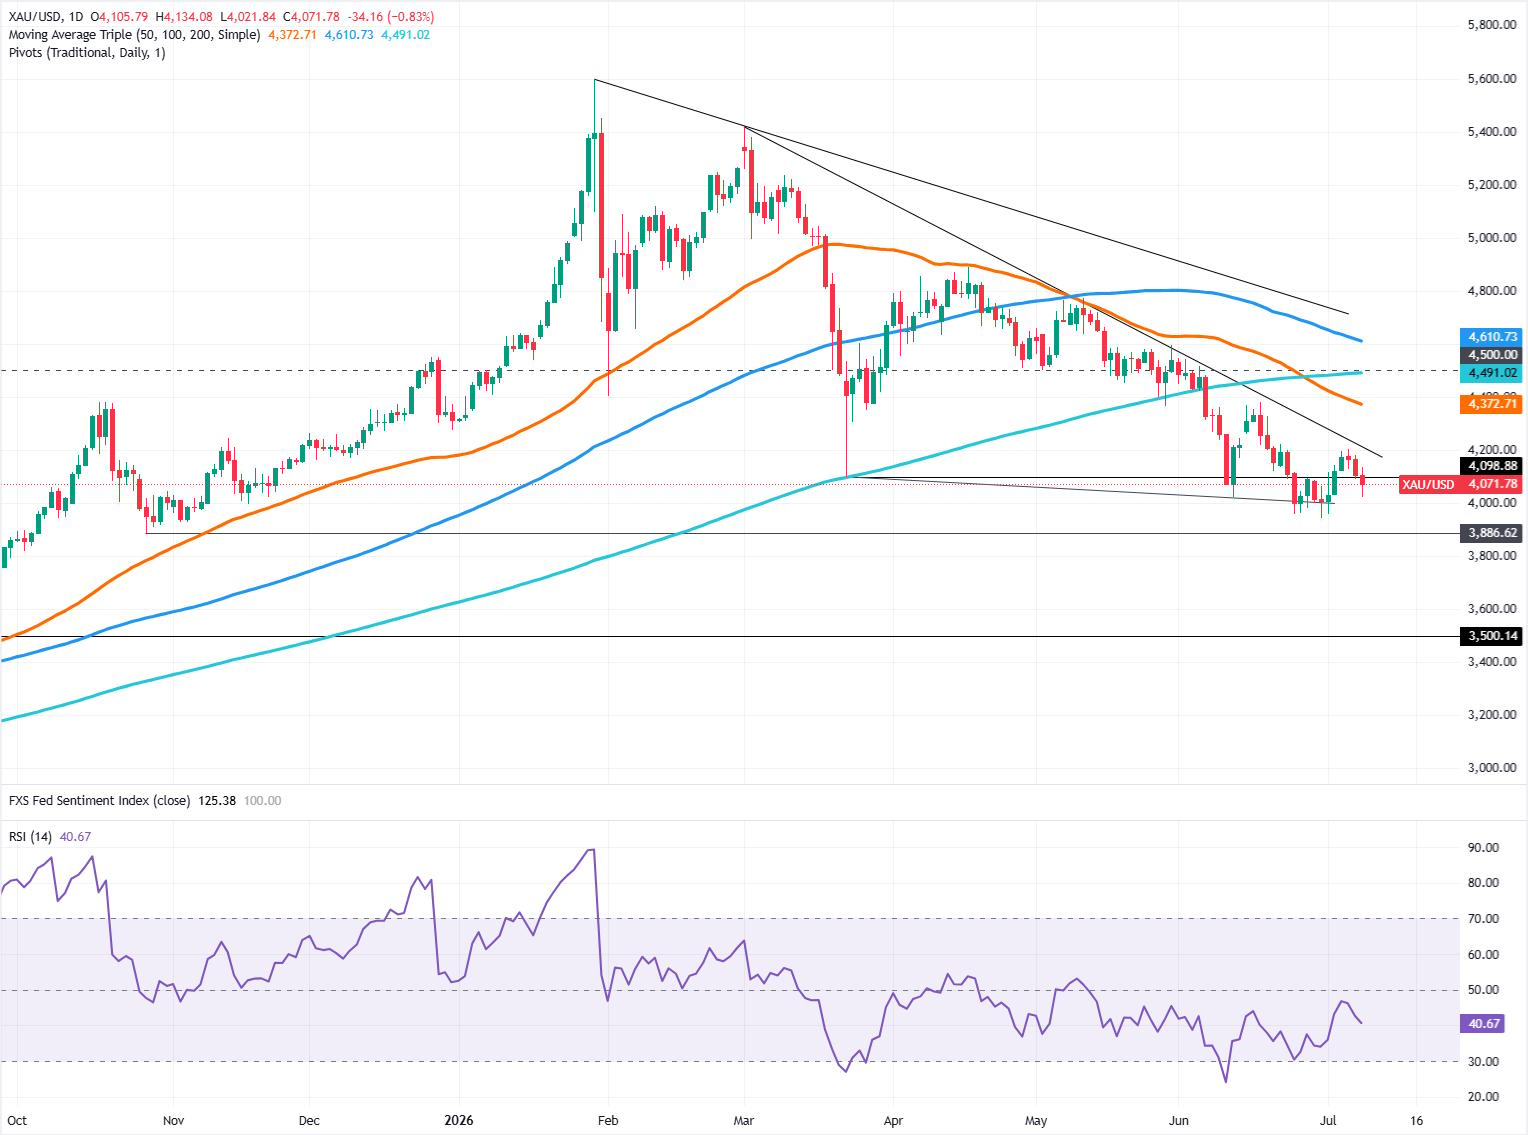
Price action shows that Gold remains downward biased, with the yellow metal falling to a new lower low for the third straight day in the week, an indication of sellers’ strength. The Relative Strength Index (RSI) confirms that bears are gaining traction, with the index pointing lower toward oversold territory.
Traders should be aware that Bullion’s daily chart shows the formation of a ‘death cross,’ an indication that in the medium and long term, further downside is seen.
For a bearish continuation, Gold must remain below $4,100. Once achieved, the next stop would be the day's low at $4,021, followed by the $4,000 milestone. On further weakness, the next stop is the year-to-date (YTD) low of $3,941, followed by the October 28, 2025, daily low of $3,886.
To shift to a bullish trend, Gold needs to break convincingly above $4,250 and target $4,300. Key resistance levels include the 50-day SMA at $4,372 and the 200-day SMA at $4,491, with $4,500 also within reach.
Gold FAQs
Gold has played a key role in human’s history as it has been widely used as a store of value and medium of exchange. Currently, apart from its shine and usage for jewelry, the precious metal is widely seen as a safe-haven asset, meaning that it is considered a good investment during turbulent times. Gold is also widely seen as a hedge against inflation and against depreciating currencies as it doesn’t rely on any specific issuer or government.
Central banks are the biggest Gold holders. In their aim to support their currencies in turbulent times, central banks tend to diversify their reserves and buy Gold to improve the perceived strength of the economy and the currency. High Gold reserves can be a source of trust for a country’s solvency. Central banks added 1,136 tonnes of Gold worth around $70 billion to their reserves in 2022, according to data from the World Gold Council. This is the highest yearly purchase since records began. Central banks from emerging economies such as China, India and Turkey are quickly increasing their Gold reserves.
Gold has an inverse correlation with the US Dollar and US Treasuries, which are both major reserve and safe-haven assets. When the Dollar depreciates, Gold tends to rise, enabling investors and central banks to diversify their assets in turbulent times. Gold is also inversely correlated with risk assets. A rally in the stock market tends to weaken Gold price, while sell-offs in riskier markets tend to favor the precious metal.
The price can move due to a wide range of factors. Geopolitical instability or fears of a deep recession can quickly make Gold price escalate due to its safe-haven status. As a yield-less asset, Gold tends to rise with lower interest rates, while higher cost of money usually weighs down on the yellow metal. Still, most moves depend on how the US Dollar (USD) behaves as the asset is priced in dollars (XAU/USD). A strong Dollar tends to keep the price of Gold controlled, whereas a weaker Dollar is likely to push Gold prices up.
Recommended Articles


