


Gold edges lower as firmer US Dollar caps recovery
- Gold falls as the US Dollar rebounds at the start of the week.
- Weak US NFP data and easing Oil-driven inflation concerns reduce expectations of a near-term Fed rate hike.
- The technical picture remains neutral above the $4,000 support level.
Gold (XAU/USD) edges lower on Monday as a firmer US Dollar (USD) and mild profit-taking cap gains following last week's rebound from a more than seven-month low of $3,941. At the time of writing, XAU/USD trades around $4,153 after briefly climbing above the $4,200 level during the Asian trading session.
Despite the intraday pullback, Gold remains supported, as weaker-than-expected US Nonfarm Payrolls (NFP) data released on Thursday have reduced expectations of an immediate Federal Reserve (Fed) interest rate hike.
Meanwhile, Oil-driven inflation risks are also easing as shipping through the Strait of Hormuz continues to improve following last month's signature of a 60-day Memorandum of Understanding (MoU) between the United States and Iran. This suggests the Fed may not need to tighten policy as aggressively as markets had previously expected.
However, monetary policy is expected to remain restrictive until inflation shows clearer signs of cooling. Traders are currently pricing in a 56% probability of a rate increase at the September meeting, according to the CME FedWatch Tool.
The US and Iran have yet to reach a final agreement, with the future management of the Strait of Hormuz emerging as a key sticking point. Tehran views the strategic waterway as falling within its sovereignty and seeks to impose transit tolls. The next round of talks is expected to resume later this week following the funeral of Iran's Supreme Leader.
With geopolitical risks still in play and expectations that the Fed will keep borrowing costs elevated, the US Dollar continues to attract buyers. The US Dollar Index (DXY), which tracks the Greenback's value against a basket of six major currencies, trades around 101.07, up 0.20% on the day.
A stronger US Dollar makes Gold more expensive for holders of other currencies, while higher interest rates diminish the appeal of the non-yielding asset.
Looking ahead, the US economic calendar is relatively quiet this week. The ISM Services Purchasing Managers Index (PMI) is due at 14:00 GMT, followed by the ADP Employment Change (4-week average) on Tuesday, the FOMC meeting minutes on Wednesday, and weekly Initial Jobless Claims on Thursday.
These reports could offer fresh clues about the Fed's next move and influence the direction of the US Dollar and Gold.
Technical analysis: XAU/USD holds above $4,000, upside remains limited
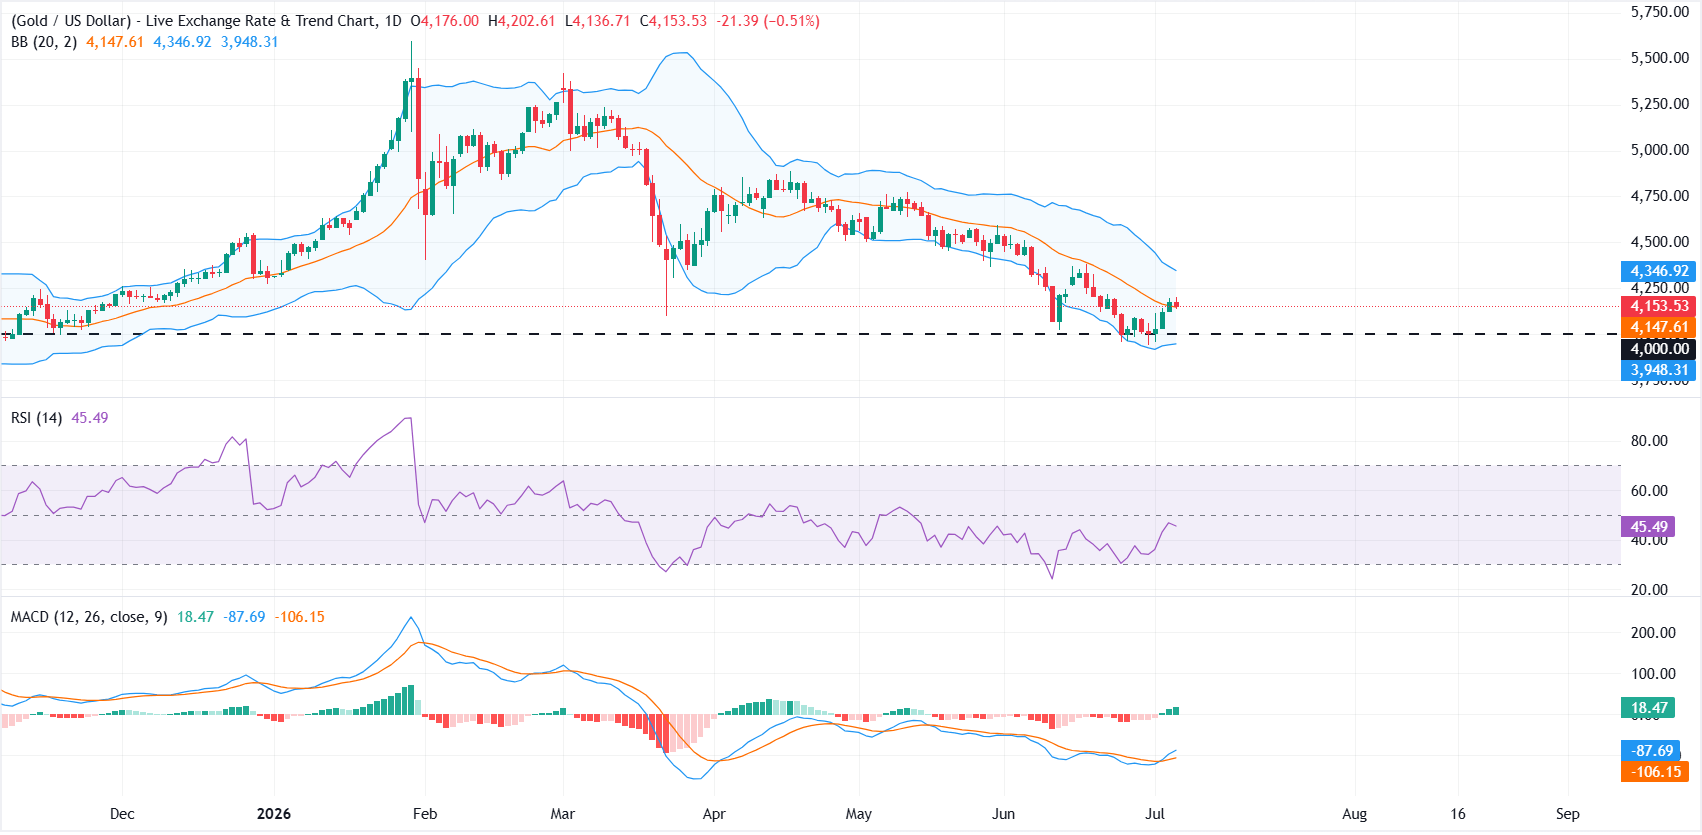
On the daily chart, XAU/USD hovers just above the 20-day Bollinger Simple Moving Average (SMA) at around $4,147, leaving the near-term tone broadly neutral.
The Relative Strength Index (RSI) around 46 hints at subdued directional conviction, while the Moving Average Convergence Divergence (MACD) holds in positive territory, suggesting that upside attempts remain possible but not yet decisive.
On the downside, immediate support is seen at the Bollinger SMA pivot around $4,147, followed by the horizontal support at $4,000. A break below that level could expose the lower Bollinger Band near $3,948.
On the topside, a clear break of the upper Bollinger band near $4,347 would be needed to re-open the path for a stronger recovery, with a daily close above that zone likely to tilt the bias back in favor of the bulls.
(This article was created with the help of an Artificial Intelligence tool and reviewed by an editor. Know more.)
Recommended Articles


