

Here's where Gold could head next after the WGC pencils in $5,000 as upside ceiling
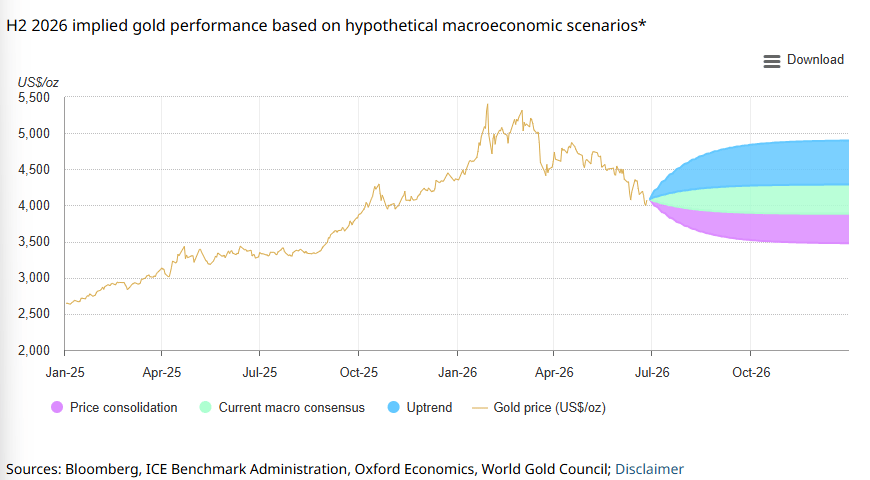
- Gold is expected to trade broadly range-bound around $4,100 during the second half of the year, according to the World Gold Council.
- The precious metal could resume its upward trend, but it needs a clear catalyst.
- Gold prices lost more than 11% in June, weighed by a revival of the US Dollar and a hawkish Fed stance.
Gold prices are expected to trade broadly stable in the second half of the year, seesawing within a 5% range from current levels of around $4,100 per troy ounce, according to analysts at the World Gold Council (WGC).
The precious metal, which experienced a rollercoaster ride in the first half of 2026, is now seen in line with macroeconomic consensus expectations and trading close to its fair value.
“At current levels, gold’s price is broadly in line with a global backdrop of moderate growth, cooling but still elevated inflation, and expectations of further – but limited – central bank tightening,” the WGC said in its mid-year outlook report.
Bullish scenario possible, but not up to recent all-time highs
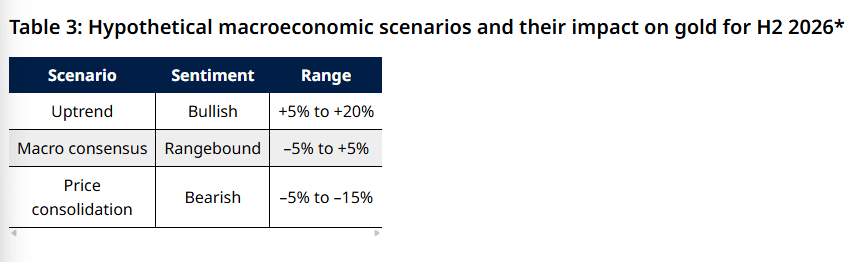
While the WGC outlook doesn’t project big swings in Gold prices as its baseline scenario, it considers the possibility of a breakout. That, however, would require a clear catalyst, namely worsening economic or geopolitical conditions, a reversal in interest-rate expectations, and/or long-term investor participation.
Such factors could propel Gold toward $4,500, but only a “strong, clear signal” may push it sustainably toward $5,000. In any case, WGC analysts don’t see the precious metal back to the $5,600 all-time high reached at the end of January.
Any further downside should be limited due to dip buying
Gold’s performance has been subdued in the past few months. The metal lost 11% in June, and, when looking at the broader period between April and June, it posted its steepest quarterly retreat since 2Q 2013.
The WGC notes that several factors could still drag the commodity further down. These are US Dollar strength, rising interest rates beyond current expectations, an improvement in market risk sentiment, and technical factors.
Still, the maximum decline expected is of 15% from current price levels as, historically, “lower prices trigger buying from various sectors.”
Central banks provide support amid India wild card
The World Gold Council's data signals a strong link between Gold returns and central bank buying. The analysis suggests that, all else equal, an additional 20 to 30 tonnes increase in reserves above the long-term average of around 600 tonnes per year should translate into approximately a 1% increase in prices.
While in the first quarter of the year many central banks opted to sell Gold to face the economic fallout from the Iran war, a recent survey suggests that sovereigns’ appetite for buying Gold remains firm.
India’s role in the Gold market is also key as the country is the second-largest consumer of the precious metal. In May, Indian Prime Minister Narendra Modi urged the nation’s citizens to avoid buying Gold for a year, in an effort to cut spending and save foreign exchange as the country grapples with the macroeconomic consequences of the Iran war. It also has adopted a series of measures to reduce imports of this commodity, including a sharp increase in duties.
The WGC analysis suggests that the country’s import duty increases alone will reduce jewellery, bar and coin demand by 50 to 60 tonnes, or about a 10% decline year-over-year.
“We believe the impact from the increased duty should already be reflected in the Gold price. But further economic deceleration could impact Indian gold demand through the well-established income effect, deterring Indian consumers and investors from taking advantage of pullbacks to enter the market,” the report said.
Gold market dynamics
The WGC also points out that much of Gold’s recent market movements have occurred during the Asian and American sessions. More specifically, many of the pullbacks happened during US hours, while rebounds generally occurred during Asian hours.
“This further highlights the increasingly relevant role that Asian investors (and consumers) play in price discovery and direction,” the report added.
Recommended Articles


