


USD/CAD Price Forecast: Technical outlook remains constructive above 1.4000
- USD/CAD rebounds from 1.4070 as the US Dollar recovers from its opening losses.
- USD/CAD holds above the 50-day and 100-day SMAs, keeping the near-term bias constructive.
- The RSI holds above 50, while an improving MACD points to fading downside pressure.
USD/CAD edges higher on Monday, paring earlier losses as the US Dollar (USD) rebounds after opening the week with a bearish gap. The Greenback initially weakened as a temporary pause in attacks between the United States (US) and Iran improved risk sentiment. At the time of writing, the pair trades around 1.4114 after bouncing from an intraday low of 1.4070.
Oil prices have erased most of last week’s gains in response to the pause, weighing on the commodity-linked Canadian Dollar (CAD). West Texas Intermediate (WTI) trades near $82.70 per barrel after hitting an intraday low of $81.28, but is still down more than 7% on the day.
Despite Monday’s decline, Oil prices remain elevated. However, the Loonie has received only limited support from higher Oil prices since the US-Iran war began, as USD/CAD remains driven mainly by US Dollar flows and monetary policy expectations amid heightened energy-driven inflation risks.
Markets see the Federal Reserve (Fed) as more likely to raise interest rates than the Bank of Canada (BoC). Against this backdrop, the near-term outlook for USD/CAD remains tilted to the upside, with technical indicators also pointing to easing selling pressure following the pullback from June’s high near 1.4250.
Technical analysis
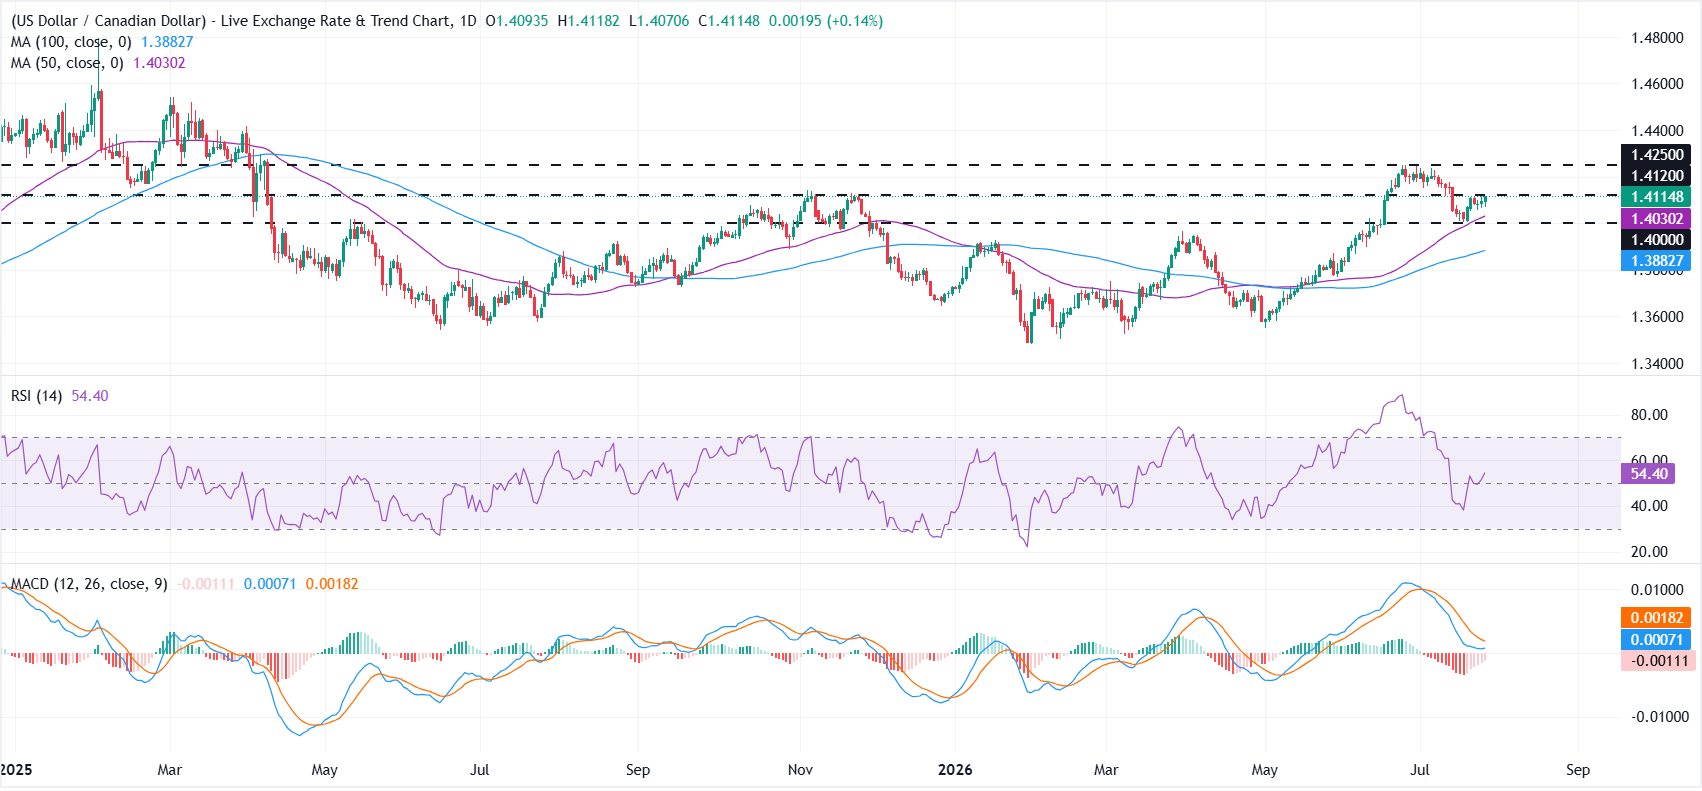
On the daily chart, USD/CAD holds a constructive near-term bias as it trades above the 50-day and 100-day Simple Moving Averages (SMAs) at 1.4030 and 1.3883, respectively.
The pair is testing nearby horizontal resistance at 1.4120, while the Relative Strength Index (RSI) around 54 suggests neutral-to-firm momentum, and the Moving Average Convergence Divergence (MACD) indicator, still slightly negative but improving, hints at waning downside pressure.
A clear break above 1.4120 could open the door toward the June high near 1.4250. On the downside, the 50-day SMA near 1.4030 closely aligns with the psychological 1.4000 mark, making this area an important support zone. The 100-day SMA at 1.3883 would provide deeper support if selling pressure picks up.
(The technical analysis of this story was written with the help of an AI tool. Know more.)
US Dollar Price Today
The table below shows the percentage change of US Dollar (USD) against listed major currencies today. US Dollar was the strongest against the British Pound.
| USD | EUR | GBP | JPY | CAD | AUD | NZD | CHF | |
|---|---|---|---|---|---|---|---|---|
| USD | -0.03% | 0.18% | -0.08% | 0.15% | -0.16% | 0.12% | 0.06% | |
| EUR | 0.03% | 0.16% | -0.07% | 0.15% | -0.16% | 0.15% | 0.07% | |
| GBP | -0.18% | -0.16% | -0.24% | -0.00% | -0.32% | -0.05% | -0.09% | |
| JPY | 0.08% | 0.07% | 0.24% | 0.20% | -0.09% | 0.19% | 0.15% | |
| CAD | -0.15% | -0.15% | 0.00% | -0.20% | -0.29% | -0.02% | -0.07% | |
| AUD | 0.16% | 0.16% | 0.32% | 0.09% | 0.29% | 0.31% | 0.22% | |
| NZD | -0.12% | -0.15% | 0.05% | -0.19% | 0.02% | -0.31% | -0.08% | |
| CHF | -0.06% | -0.07% | 0.09% | -0.15% | 0.07% | -0.22% | 0.08% |
The heat map shows percentage changes of major currencies against each other. The base currency is picked from the left column, while the quote currency is picked from the top row. For example, if you pick the US Dollar from the left column and move along the horizontal line to the Japanese Yen, the percentage change displayed in the box will represent USD (base)/JPY (quote).
Recommended Articles


