

AUD/USD Price Forecast: Bulls struggle below the 50-day SMA

Source Fxstreet
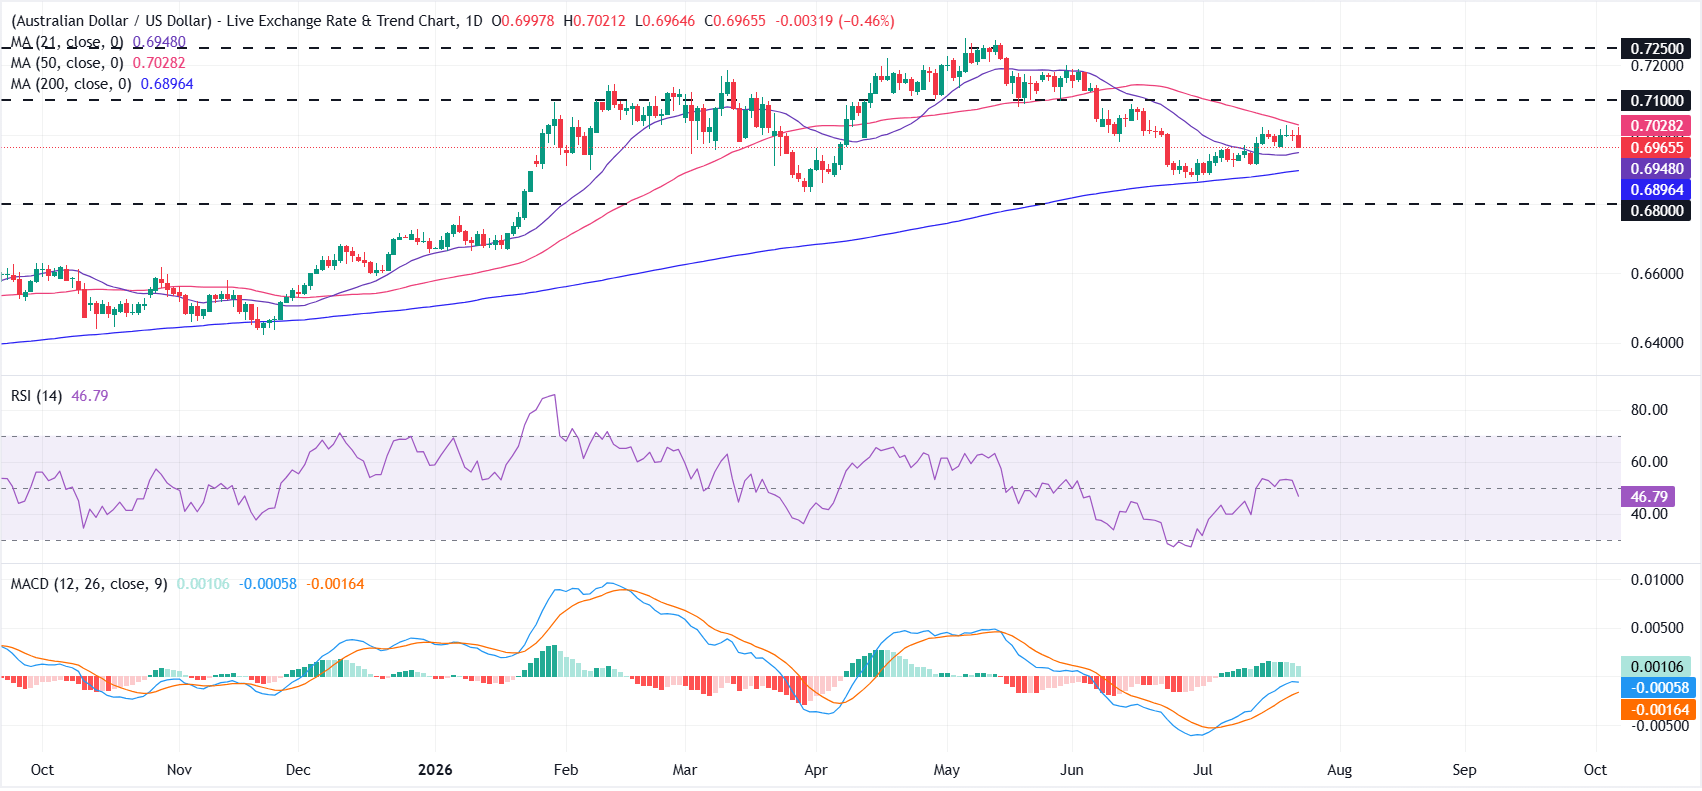
  • AUD/USD holds above the 21-day and 200-day SMAs, keeping the near-term outlook mildly positive.
  • The 50-day SMA at 0.7028 caps the upside, while momentum indicators show fading buying pressure.
  • A break below the 200-day SMA would expose the 0.6800 support level.

AUD/USD edges lower on Thursday as a stronger US Dollar (USD) outweighs support from better-than-expected Australian employment data. At the time of writing, the pair trades around 0.6966, down 0.45% on the day.

The US Dollar gains as the Middle East war lifts safe-haven demand, while the resulting surge in Oil prices adds to inflation worries and strengthens expectations that the Federal Reserve may need to raise interest rates.

The US Dollar Index (DXY), which tracks the Greenback’s value against a basket of six major currencies, trades around 101.45, its highest level in three weeks.

From a technical standpoint, AUD/USD holds above the 21-day and 200-day Simple Moving Averages (SMAs) at 0.6948 and 0.6896, respectively, keeping the near-term outlook mildly constructive. However, the pair remains capped by the 50-day SMA at 0.7028.

The Relative Strength Index (RSI) near 47 sits just below the neutral 50 level, pointing to subdued momentum. The Moving Average Convergence Divergence (MACD) indicator remains marginally positive, but the fading green histogram suggests that bullish momentum is weakening.

On the upside, initial resistance is seen at the 50-day SMA at 0.7028, followed by the horizontal barrier at 0.7100 and then 0.7250. On the downside, immediate support is located at the 21-day SMA at 0.6948, followed by the 200-day SMA at 0.6896. A sustained break below these levels would expose the 0.6800 mark.
Disclaimer: For information purposes only. Past performance is not indicative of future results.
placeholder
Intel Price Forecast: Nvidia Picked Xeon 6, Invested $5B, Yet Analysts Still Trail INTCIntel Corporation (NASDAQ: INTC) sits at $140.05, holding firm on the ascending trendline within the 2H timeframe. The RSI indicator is currently reading 55.21, positioning it as neutral-
Author  TradingKey
7 Month 02 Day Thu
Intel Corporation (NASDAQ: INTC) sits at $140.05, holding firm on the ascending trendline within the 2H timeframe. The RSI indicator is currently reading 55.21, positioning it as neutral-
placeholder
NVIDIA Price Forecast: Michael Burry Shorts NVDA, but Analysts See $299On July 1, NVIDIA (NASDAQ: NVDA) sits at $198.34, failing to break above the former support level that is now serving as resistance between $198 and $205 on the 2H chart's downward blue c
Author  TradingKey
7 Month 02 Day Thu
On July 1, NVIDIA (NASDAQ: NVDA) sits at $198.34, failing to break above the former support level that is now serving as resistance between $198 and $205 on the 2H chart's downward blue c
placeholder
Meta Compute Launch Sends AI Compute Stocks Tumbling GloballyMeta’s plan to sell surplus computing power hit chip stocks hard on Wall Street. Meta’s own shares climbed nearly 9% on the news.The announcement flipped years of assumed AI compute scarcity into a su
Author  Beincrypto
7 Month 02 Day Thu
Meta’s plan to sell surplus computing power hit chip stocks hard on Wall Street. Meta’s own shares climbed nearly 9% on the news.The announcement flipped years of assumed AI compute scarcity into a su
placeholder
Brent Crude Oil Erases Entire War Premium, Falls 40% to Pre-War LevelsBrent crude oil has erased its entire war premium, sliding roughly 40% from its March peak near $120 to trade around $72.25 on Wednesday. The move returns oil to its pre-war support base.The retreat f
Author  Beincrypto
7 Month 02 Day Thu
Brent crude oil has erased its entire war premium, sliding roughly 40% from its March peak near $120 to trade around $72.25 on Wednesday. The move returns oil to its pre-war support base.The retreat f
placeholder
Today’s Market Recap: Chip Stocks Retreat Collectively, Meta Rises Against the Trend, Non-Farm Payrolls Become the Next Key CatalystOn July 1, Eastern Time, U.S. stocks closed fluctuating lower on the first trading day of the second half of the year. Although some megacap tech stocks such as Meta (
Author  TradingKey
7 Month 02 Day Thu
On July 1, Eastern Time, U.S. stocks closed fluctuating lower on the first trading day of the second half of the year. Although some megacap tech stocks such as Meta (
goTop
quote