


AUD/USD Price Forecast: Further upside likely towards 0.7100
- AUD/USD trades higher against its major currency peers amid a risk-on mood.
- The emergence of US-Iran ceasefire hopes has revived market sentiment.
- Investors shift their focus to the Australian employment data for June.
The Australian Dollar (AUD) outperforms its major currency peers, trading 0.28% higher to near 0.7018 against the US Dollar (USD) during the European trading session on Tuesday. The antipodean gains as the market sentiment turns risk-on amid hopes that the United States (US) and Iran could stop exchanging attacks soon.
Australian Dollar Price Today
The table below shows the percentage change of Australian Dollar (AUD) against listed major currencies today. Australian Dollar was the strongest against the Japanese Yen.
| USD | EUR | GBP | JPY | CAD | AUD | NZD | CHF | |
|---|---|---|---|---|---|---|---|---|
| USD | -0.07% | -0.13% | 0.05% | -0.06% | -0.30% | -0.37% | -0.05% | |
| EUR | 0.07% | -0.05% | 0.09% | 0.01% | -0.20% | -0.31% | 0.02% | |
| GBP | 0.13% | 0.05% | 0.17% | 0.07% | -0.15% | -0.24% | 0.08% | |
| JPY | -0.05% | -0.09% | -0.17% | -0.10% | -0.32% | -0.43% | -0.09% | |
| CAD | 0.06% | -0.01% | -0.07% | 0.10% | -0.23% | -0.31% | 0.00% | |
| AUD | 0.30% | 0.20% | 0.15% | 0.32% | 0.23% | -0.09% | 0.26% | |
| NZD | 0.37% | 0.31% | 0.24% | 0.43% | 0.31% | 0.09% | 0.32% | |
| CHF | 0.05% | -0.02% | -0.08% | 0.09% | -0.01% | -0.26% | -0.32% |
The heat map shows percentage changes of major currencies against each other. The base currency is picked from the left column, while the quote currency is picked from the top row. For example, if you pick the Australian Dollar from the left column and move along the horizontal line to the US Dollar, the percentage change displayed in the box will represent AUD (base)/USD (quote).
In the European trade, S&P 500 futures are 0.45% higher to near 7,477, reflecting an upbeat market mood. The US Dollar Index (DXY), which tracks the Greenback’s value against six major currencies, trades 0.11% lower to near 100.89, signifying diminishing appeal of safe-haven assets.
On Monday, Iran confirmed receiving a proposal from mediators stating a 10-day cessation of strikes to find ways to revive the interim deal.
On the domestic front, investors await the employment data for June, which will be released on Thursday. Australian labor market report is expected to show that the economy created 15K fresh jobs, lower than 40.3K in May. The Unemployment Rate is seen remaining steady at 4.4%.
This week, investors will also focus on the preliminary Australia and the US private sector Purchasing Managers’ Index (PMI) data for July, which will be released on Friday.
AUD/USD technical analysis
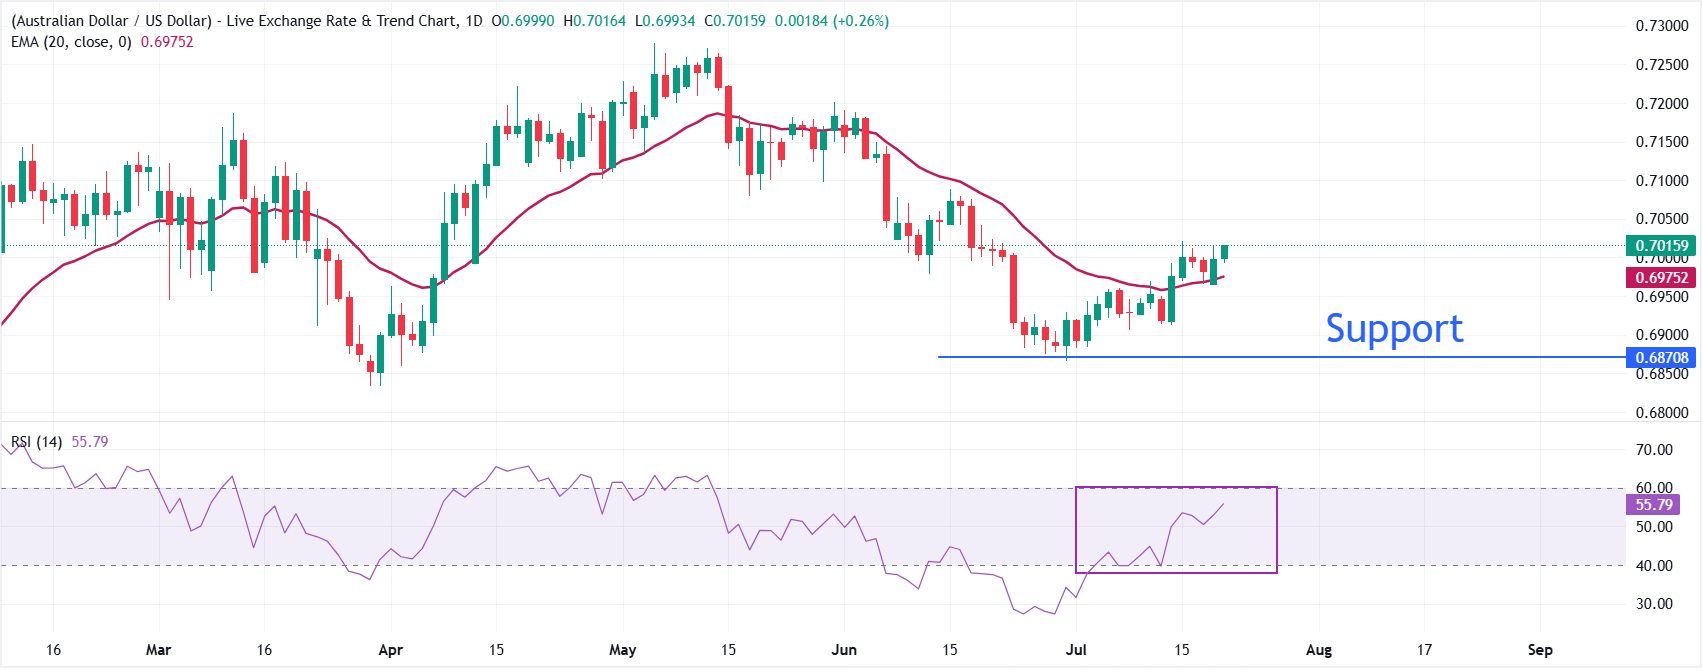
AUD/USD trades higher at around 0.7016, maintaining a constructive near-term tone as spot remains above the 20-day exponential moving average (EMA) at 0.6975, hinting at emerging underlying demand after the recent recovery. Momentum is supportive, with the Relative Strength Index (14) advancing to 55.8, suggesting bullish pressure is building without yet reaching overbought territory.
On the downside, immediate support is seen at the 20-day EMA at 0.6975, followed by the June 30 low at 0.6865. Looking up, the pair could extend its recovery towards 0.7100.
(The technical analysis of this story was written with the help of an AI tool. Know more.)
Economic Indicator
Employment Change s.a.
The Employment Change released by the Australian Bureau of Statistics is a measure of the change in the number of employed people in Australia. The statistic is adjusted to remove the influence of seasonal trends. Generally speaking, a rise in Employment Change has positive implications for consumer spending, stimulates economic growth, and is bullish for the Australian Dollar (AUD). A low reading, on the other hand, is seen as bearish.
Read more.Next release: Thu Jul 23, 2026 01:30
Frequency: Monthly
Consensus: 15K
Previous: 40.3K
Source: Australian Bureau of Statistics
Recommended Articles


