


Euro slides as Waller warning, Iran strikes lift US Dollar
- Waller says hot core CPI could trigger hike debate.
- Middle East escalation lifts Oil, yields and Dollar demand.
- US CPI and Warsh testimony drive next policy catalyst.
The shared currency begins the week on a lower note, down 0.31% as risk aversion fueled flows towards the US Dollar amid heightened tensions in the Middle East. Also, hawkish comments by a Fed official underpinned US Treasury yields, suggesting markets expect the US central bank to raise rates. The EUR/USD trades at 1.1379 after reaching a high of 1.1445.
EUR/USD falls as Oil shock revives Fed tightening fears
The strength of the US Dollar is the main reason the Euro is being battered. The positive correlation between the Greenback and Oil prices suggests that a rally in crude prices triggers a flight to safety in the foreign exchange market. Why? Because high energy prices fuel speculation that major central banks — including the Federal Reserve- might need to raise interest rates.
Alongside the challenging geopolitical environment, Fed Governor Christopher Waller noted that a high core inflation reading would prompt immediate consideration of a rate hike. Although he maintains a hawkish stance, he believes it's plausible inflation could hit the 2% target without increasing rates and mentioned that the labor market is nearer to the Fed’s maximum employment objective.
This triggered a jump in US Treasury yields, with the US 10-year T-note surging 6 basis points to 4.624%, indicating that investors are preparing for an imminent rate hike by the Fed.
Consequently, the US Dollar Index (DXY), which measures the value of the American currency against six other currencies, is up 0.32% at 101.28.
Money markets are pricing in nearly 42 basis points of Federal Reserve tightening, according to Prime Terminal data.
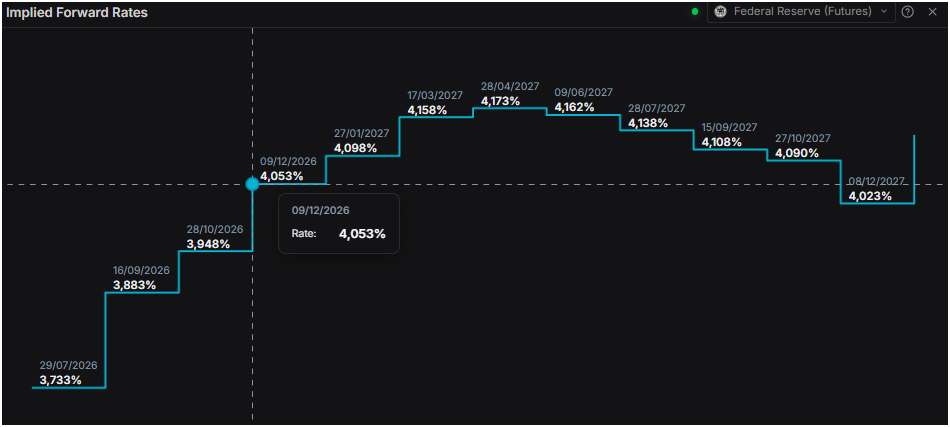
Breaking news revealed that US CENTCOM announced at 16:45 ET that it began launching a third consecutive night of strikes against Iran. Iranian media reported that explosions were heard in Bandar Abbas and revealed that Iran’s army targeted US military facilities in Kuwait and a “hostile” US vessel with cruise missiles.
The US economic docket will feature the release of crucial US inflation data and the testimony of Fed Chair Kevin Warsh before the US Congress. Across the pond, the Eurozone schedule ill feature a speech by the European Central Bank (ECB) President Christine Lagarde.
EUR/USD Price Forecast: Technical outlook
In the daily chart, EUR/USD trades at 1.1385, keeping a bearish near-term bias as the pair holds beneath the clustered 50-, 100- and 200-day Simple Moving Average (SMA) around 1.1554 and within a downward parallel channel. The Relative Strength Index (RSI) at about 37 stays in bearish territory, suggesting downside pressure persists while the price remains capped by the channel structure and the descending trend-line that was previously broken near 1.1600.
On the topside, initial resistance is seen near 1.1422, where the lower boundary of the current downward channel now sits above spot, followed by the grouped daily SMAs around 1.1554, which reinforce the broader cap. Further up, the channel top near 1.1596 and the prior trend-line break area at 1.1600 form a dense resistance band ahead of the horizontal barrier at 1.1849, while the absence of clearly defined support below the market leaves EUR/USD vulnerable to further weakness if selling resumes.
(The technical analysis of this story was written with the help of an AI tool. Know more.)
Euro FAQs
The Euro is the currency for the 20 European Union countries that belong to the Eurozone. It is the second most heavily traded currency in the world behind the US Dollar. In 2022, it accounted for 31% of all foreign exchange transactions, with an average daily turnover of over $2.2 trillion a day. EUR/USD is the most heavily traded currency pair in the world, accounting for an estimated 30% off all transactions, followed by EUR/JPY (4%), EUR/GBP (3%) and EUR/AUD (2%).
The European Central Bank (ECB) in Frankfurt, Germany, is the reserve bank for the Eurozone. The ECB sets interest rates and manages monetary policy. The ECB’s primary mandate is to maintain price stability, which means either controlling inflation or stimulating growth. Its primary tool is the raising or lowering of interest rates. Relatively high interest rates – or the expectation of higher rates – will usually benefit the Euro and vice versa. The ECB Governing Council makes monetary policy decisions at meetings held eight times a year. Decisions are made by heads of the Eurozone national banks and six permanent members, including the President of the ECB, Christine Lagarde.
Eurozone inflation data, measured by the Harmonized Index of Consumer Prices (HICP), is an important econometric for the Euro. If inflation rises more than expected, especially if above the ECB’s 2% target, it obliges the ECB to raise interest rates to bring it back under control. Relatively high interest rates compared to its counterparts will usually benefit the Euro, as it makes the region more attractive as a place for global investors to park their money.
Data releases gauge the health of the economy and can impact on the Euro. Indicators such as GDP, Manufacturing and Services PMIs, employment, and consumer sentiment surveys can all influence the direction of the single currency. A strong economy is good for the Euro. Not only does it attract more foreign investment but it may encourage the ECB to put up interest rates, which will directly strengthen the Euro. Otherwise, if economic data is weak, the Euro is likely to fall. Economic data for the four largest economies in the euro area (Germany, France, Italy and Spain) are especially significant, as they account for 75% of the Eurozone’s economy.
Another significant data release for the Euro is the Trade Balance. This indicator measures the difference between what a country earns from its exports and what it spends on imports over a given period. If a country produces highly sought after exports then its currency will gain in value purely from the extra demand created from foreign buyers seeking to purchase these goods. Therefore, a positive net Trade Balance strengthens a currency and vice versa for a negative balance.
Recommended Articles


