


EUR/GBP Price Forecast: Steadies near 0.8500 with upside attempts limited
- EUR/GBP consolidates losses at 0.8515 on Monday after dropping nearly 2% in the last three weeks.
- Escalating tensions in the Middle East and higher Oil prices are keeping Euro bulls subdued.
- Technical indicators suggest that the Pound's bullish trend might be losing steam.
The Euro (EUR) is trading practically flat against the British Pound (GBP) on Monday after dropping about 2% over the past three weeks. Euro bulls remain subdued amid the risk-averse mood, but sellers are struggling to find acceptance below 0.8500.
Escalating tensions in the Middle East and the closure of the Strait of Hormuz are weighing heavily on the Euro, as higher Oil prices are pressuring the European Central Bank (ECB) to hike rates further in the context of sluggish economic growth.
The British Pound, by contrast, is showing resilience amid the US-Iran conflict and the political impasse in the UK. Investors have granted the benefit of the doubt to Andrew Burnham, who is expected to be nominated leader of the Labour Party on Friday and Prime Minister on July 20.
Technical Analysis: Bears are showing signs of exhaustion
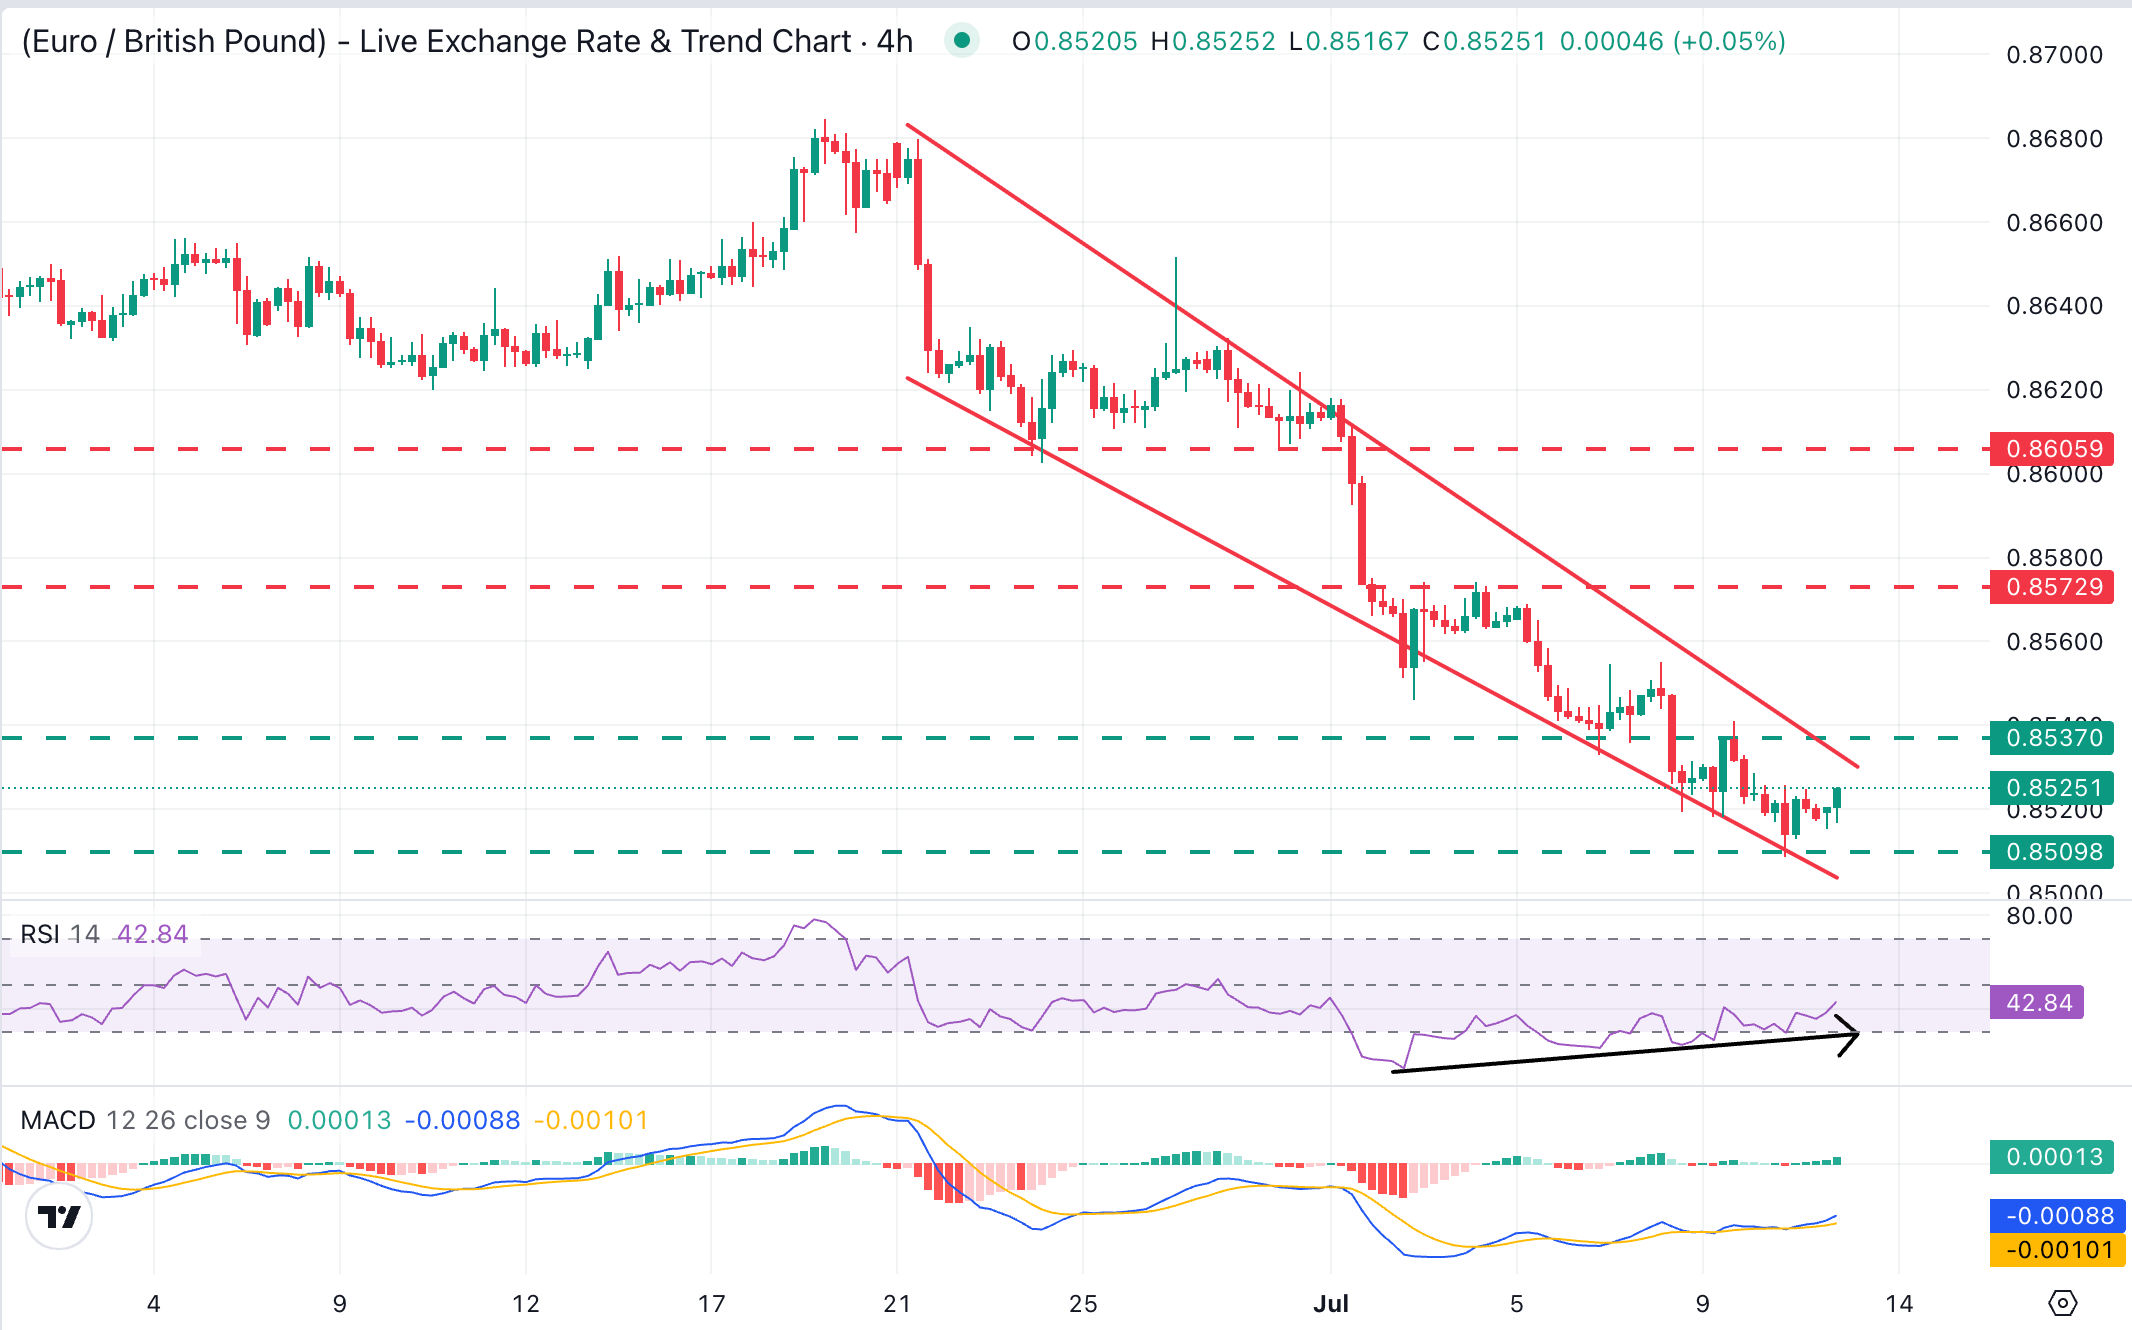
EUR/GBP trades at 0.8520, trading within a descending wedge, yet with momentum indicators hinting at a fading bearish impulse and the four-hour Relative Strength Index (14) showing a bullish divergence as it trends toward the 50 midline. Beyond that, the Moving Average Convergence Divergence (MACD) line, in the same timeframe, hovers slightly above zero, adding to the case for a potential bullish correction.
On the downside, immediate support is located at Friday's low in the 0.8510 area, ahead of the wedge bottom, now around 0.8500. Below these levels, there is no clear support area ahead of the early June 2025 lows, in the area of 0.8420.
On the topside, initial resistance is aligned with the descending trendline barrier, now around 0.8530, followed closely by a previous support-turned-resistance in the 0.8535 area. A confirmation above these levels would ease bearish pressure and shift the focus to the July 2, 3, and 6 highs, around 0.8570.
(The technical analysis of this story was written with the help of an AI tool. Know more.)
Euro Price Today
The table below shows the percentage change of Euro (EUR) against listed major currencies today. Euro was the strongest against the Australian Dollar.
| USD | EUR | GBP | JPY | CAD | AUD | NZD | CHF | |
|---|---|---|---|---|---|---|---|---|
| USD | 0.08% | 0.12% | 0.34% | 0.05% | 0.32% | -0.04% | 0.03% | |
| EUR | -0.08% | 0.05% | 0.24% | -0.03% | 0.25% | -0.09% | -0.04% | |
| GBP | -0.12% | -0.05% | 0.22% | -0.08% | 0.22% | -0.12% | -0.04% | |
| JPY | -0.34% | -0.24% | -0.22% | -0.29% | -0.01% | -0.34% | -0.25% | |
| CAD | -0.05% | 0.03% | 0.08% | 0.29% | 0.29% | -0.02% | 0.04% | |
| AUD | -0.32% | -0.25% | -0.22% | 0.01% | -0.29% | -0.30% | -0.25% | |
| NZD | 0.04% | 0.09% | 0.12% | 0.34% | 0.02% | 0.30% | 0.08% | |
| CHF | -0.03% | 0.04% | 0.04% | 0.25% | -0.04% | 0.25% | -0.08% |
The heat map shows percentage changes of major currencies against each other. The base currency is picked from the left column, while the quote currency is picked from the top row. For example, if you pick the Euro from the left column and move along the horizontal line to the US Dollar, the percentage change displayed in the box will represent EUR (base)/USD (quote).
Recommended Articles


