


AUD/USD Price Forecast: 0.6860 is key support level amid geopolitical risks
- The Australian Dollar edges up against the US Dollar despite multiple headwinds.
- Middle East war may last longer due to US attacks on Iranian infrastructure.
- The FOMC minutes show that several policymakers see the need for monetary policy tightening.
The Australian Dollar (AUD) trades marginally higher at around 0.6935 against the US Dollar (USD) during the European trading session on Thursday. The Aussie pair edges up as the US Dollar ticks lower despite escalating Middle East risks and hawkish Federal Open Market Committee (FOMC) Minutes of the June policy meeting.
At press time, the US Dollar Index (DXY), which gauges the Greenback’s value against six major currencies, trades 0.13% lower to near 100.92.
The attacks on Iranian infrastructure by United States (US) military forces signal that the restart of the war would last long, a scenario that might keep oil prices higher and the appeal of safe-haven assets upbeat. According to Axios, the US Air Force bombed two railway bridges in Iran on Wednesday.
Meanwhile, the FOMC Minutes showed on Wednesday that policymakers are concerned about upside inflation risks and several of them see the need to tighten monetary conditions to ease price pressures.
In the Australian region, traders might consider raising hawkish Reserve Bank of Australia (RBA) bets again as Assistant Governor Sarah Hunter has reiterated that the central bank would act, if needed, for inflation to return to target and maintain sustainable full employment.
Lately, traders pared hawkish RBA bets as the Australian monthly Consumer Price Index (CPI) has cooled down in the last two months.
AUD/USD technical analysis
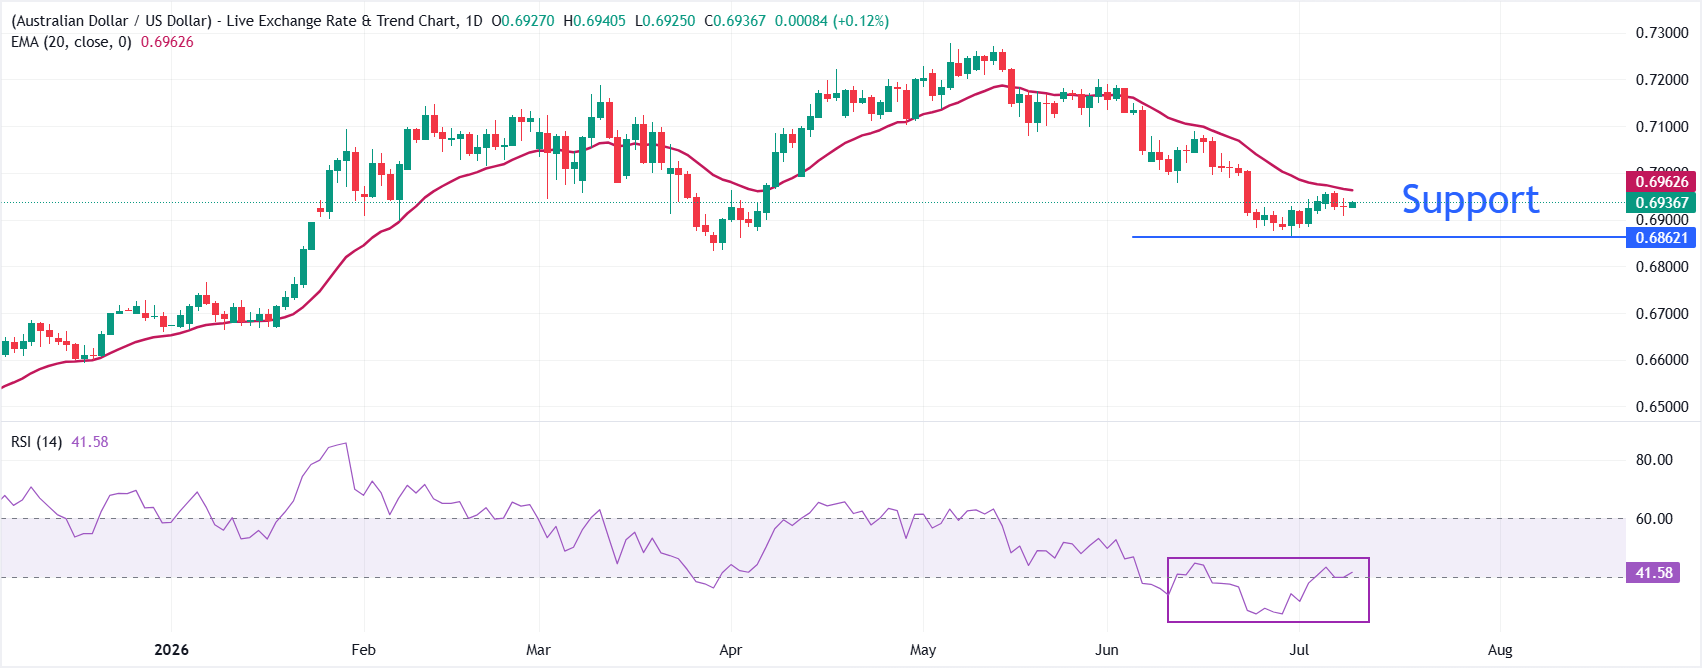
AUD/USD trades slightly higher at around 0.6936, but maintains a bearish near-term tone as it remains below the 20-period exponential moving average (EMA) at 0.6963.
The pair has been unable to reclaim this short-term trend proxy, suggesting that rallies are likely to be capped while price holds under the EMA. The Relative Strength Index (RSI) at 41.46 stays below the midline, hinting at persistent, though not extreme, selling pressure.
On the topside, initial resistance is defined by the 20-period EMA at 0.6963, which is the first level bulls would need to overcome to ease the current downside bias. Above the moving average, the next resistance for the pair will be the psychological level of 0.7000. Looking down, the June low at 0.6865 is the key support level; a break below that would expose the pair to the March low at 0.6833.
(The technical analysis of this story was written with the help of an AI tool. Know more.)
Economic Indicator
FOMC Minutes
FOMC stands for The Federal Open Market Committee that organizes 8 meetings in a year and reviews economic and financial conditions, determines the appropriate stance of monetary policy and assesses the risks to its long-run goals of price stability and sustainable economic growth. FOMC Minutes are released by the Board of Governors of the Federal Reserve and are a clear guide to the future US interest rate policy.
Last release: Wed Jul 08, 2026 18:00
Frequency: Irregular
Actual: -
Consensus: -
Previous: -
Source: Federal Reserve
Minutes of the Federal Open Market Committee (FOMC) is usually published three weeks after the day of the policy decision. Investors look for clues regarding the policy outlook in this publication alongside the vote split. A bullish tone is likely to provide a boost to the greenback while a dovish stance is seen as USD-negative. It needs to be noted that the market reaction to FOMC Minutes could be delayed as news outlets don’t have access to the publication before the release, unlike the FOMC’s Policy Statement.
Recommended Articles


