


USD/CHF Price Forecast: Aiming for the 0.8065 area amid wide US Dollar strength
- USD/CHF breaks above 0.8050 and aims for a previous support area around 0.8065.
- A cautious market mood and weak Swiss employment figures are weighing on the Swissie on Monday.
- The daily chart shows a potential morning star formation in progress, a bullish sign.
The Swiss Franc (CHF) pares recent gains against the US Dollar (USD) on Monday, as fresh frictions in the Middle East are dampening investors’ appetite for risk in an otherwise calm market session. The USD/CHF pair’s rebound from two-and-a-half-week lows near 0.8000 has extended beyond 0.8050, aiming for the 0.8070 area.
Comments from Iranian authorities reiterating their willingness to control the Strait of Hormuz and collect fees from vessels crossing the critical waterway cast a shadow over the fragile ceasefire, as the US rejects that option. Beyond that, fresh hostilities in Lebanon and reciprocal threats between Iran and Israel add pressure on the peace process.
In Switzerland, an unexpected increase in the Unemployment Rate, which hit a nearly five-year high at 3.1% in June, from 3% in May, added weight to the Swissie. Later in the day in the US, the ISM Services PMI is expected to show a moderate slowdown, yet remain at levels consistent with healthy activity. At a later time, Federal Reserve Governor Christopher Waller is expected to meet the press.
Technical Analysis: A Morning Start candlestick formation is in progress
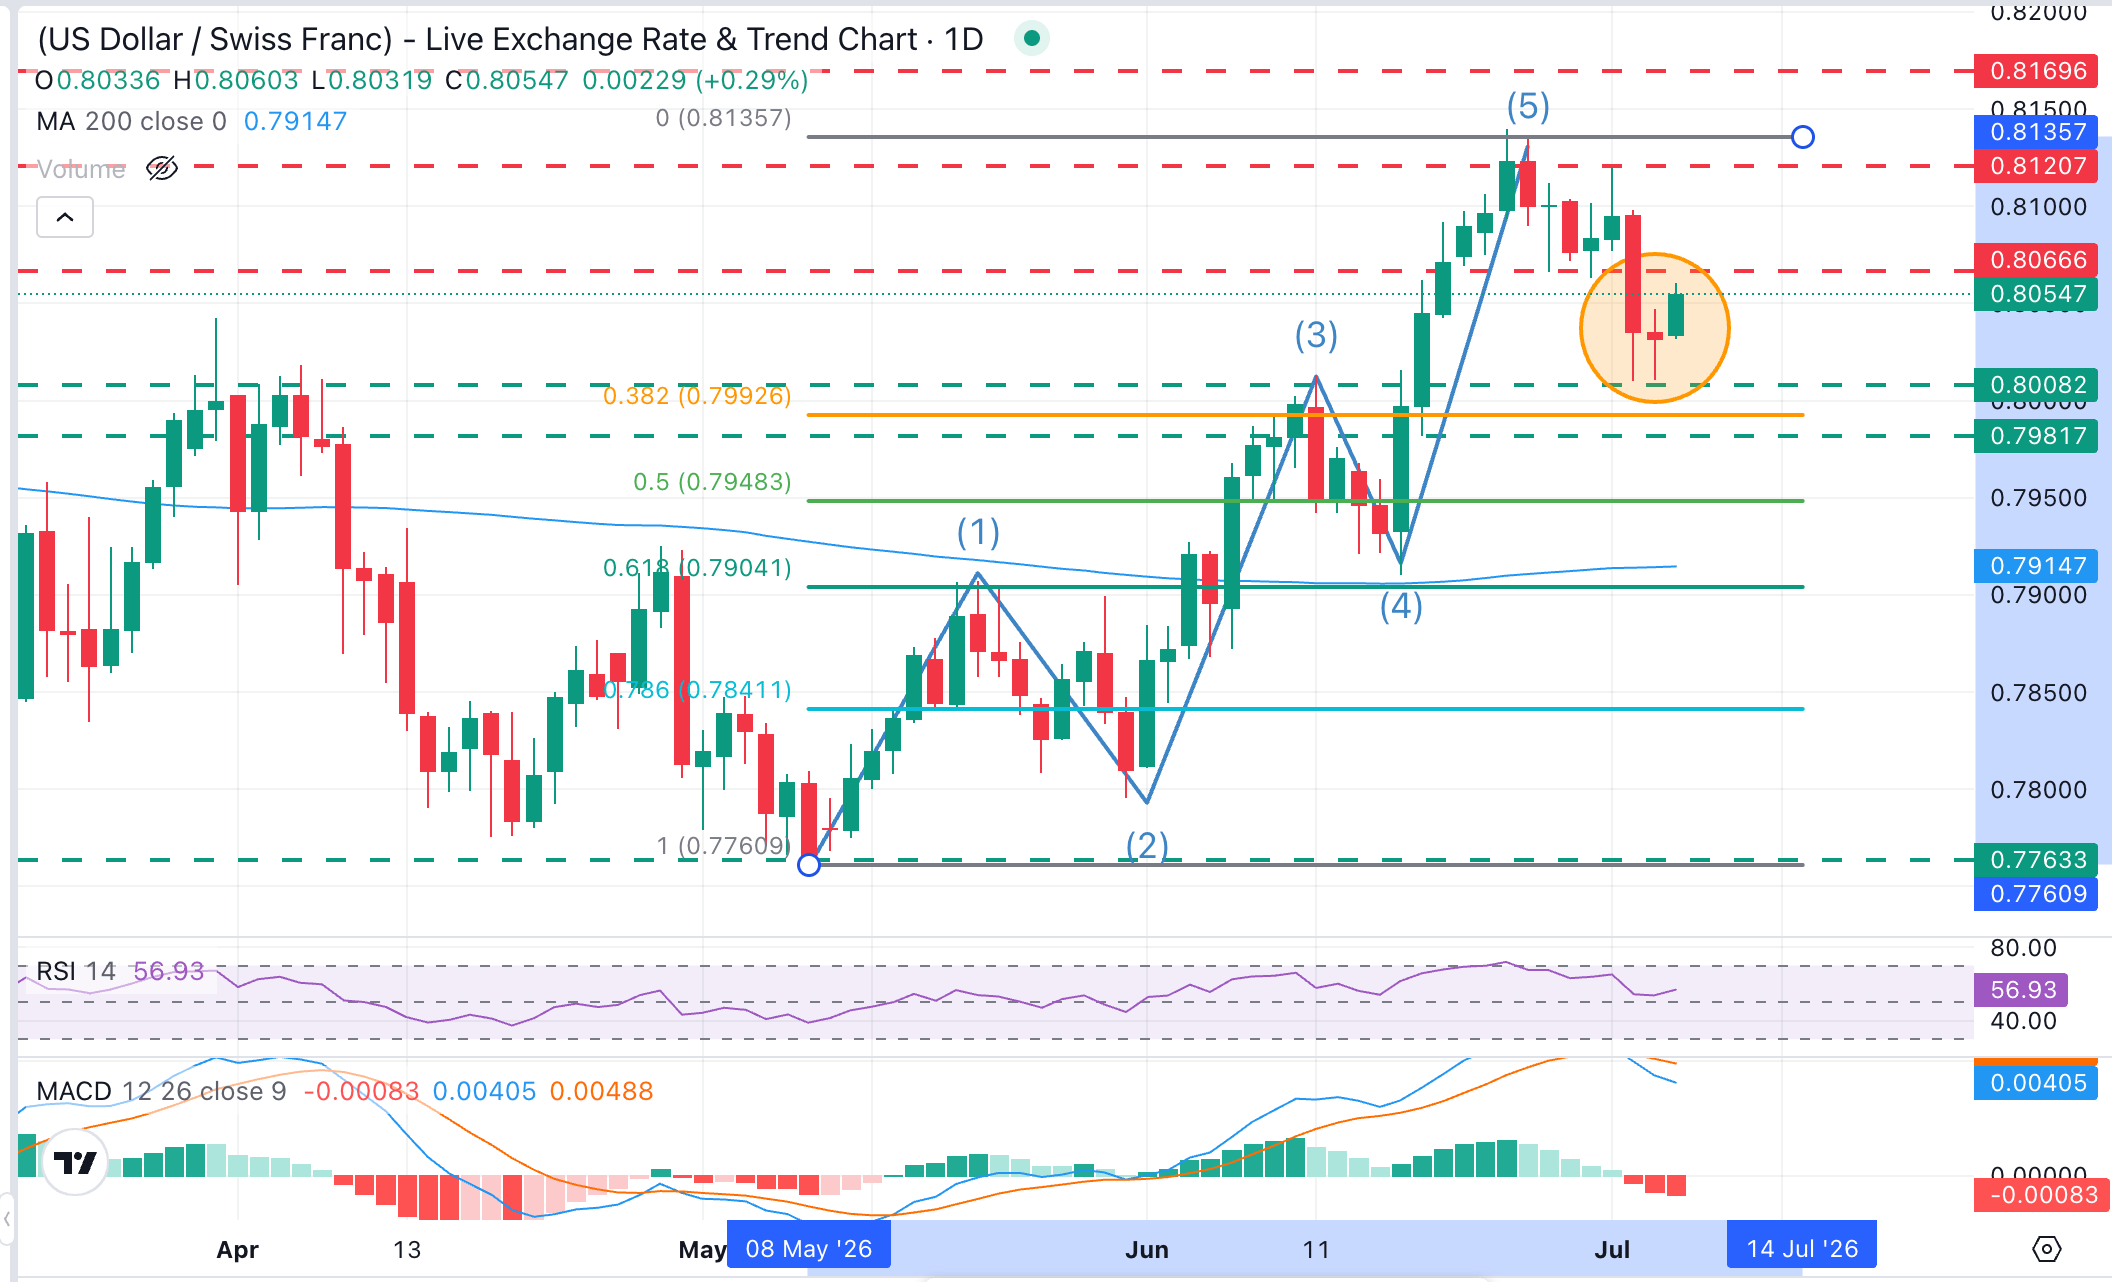
USD/CHF trades at 0.8054, with recent price action suggesting that the pair is in an A-B-C corrective reversal, following a 5-wave (Elliot Wave) bullish cycle. In that sense, a daily close above the June 26 and 30 lows in the 0.8065 area would confirm a Morning Star candle formation, a bullish sign suggesting that the bearish correction might have concluded.
Momentum indicators in the daily chart are mixed. The Relative Strength Index (14) around 57 hints at constructive but not overextended momentum, while the Moving Average Convergence Divergence (MACD) turning slightly negative suggests upside may be slowing rather than reversing.
On the topside, a confirmation above the mentioned 0.8065 shifts the focus towards the area between 0.8120 and 0.8140 (June 24, 26, and July 1 highs), ahead of the August 2025 high, at 0.8170.
On the downside, the 0.8000 psychological area held bears last week. A bearish reaction below here would expose the key support area where mid-June lows meet the 200-day SMA, around 0.7915, and the 61.8% Fibonacci retracement of the May-June rally, at the 0.7900 area.
(This article was created with the help of an Artificial Intelligence tool and reviewed by an editor. Know more.)
US Dollar Price Today
The table below shows the percentage change of US Dollar (USD) against listed major currencies today. US Dollar was the strongest against the Japanese Yen.
| USD | EUR | GBP | JPY | CAD | AUD | NZD | CHF | |
|---|---|---|---|---|---|---|---|---|
| USD | 0.17% | 0.10% | 0.57% | 0.21% | 0.12% | 0.51% | 0.25% | |
| EUR | -0.17% | -0.07% | 0.43% | 0.06% | -0.02% | 0.34% | 0.09% | |
| GBP | -0.10% | 0.07% | 0.48% | 0.09% | -0.01% | 0.42% | 0.18% | |
| JPY | -0.57% | -0.43% | -0.48% | -0.37% | -0.44% | -0.09% | -0.25% | |
| CAD | -0.21% | -0.06% | -0.09% | 0.37% | -0.10% | 0.30% | 0.08% | |
| AUD | -0.12% | 0.02% | 0.01% | 0.44% | 0.10% | 0.41% | 0.18% | |
| NZD | -0.51% | -0.34% | -0.42% | 0.09% | -0.30% | -0.41% | -0.24% | |
| CHF | -0.25% | -0.09% | -0.18% | 0.25% | -0.08% | -0.18% | 0.24% |
The heat map shows percentage changes of major currencies against each other. The base currency is picked from the left column, while the quote currency is picked from the top row. For example, if you pick the US Dollar from the left column and move along the horizontal line to the Japanese Yen, the percentage change displayed in the box will represent USD (base)/JPY (quote).
Recommended Articles


