

EUR/USD Price Forecasts: Nears weekly top at 1.1435 with bearish momentum easing
- EUR/USD edged up above 1.1400 but remains within the weekly range below 1.1435.
- The US Dollar has trimmed previous gains, as investors brace for the US Nonfarm Payrolls release.
- Technically, the Euro remains on the defensive while below trendline resistance in the 1.1550 area
The Euro (EUR) trades higher on Thursday against the US Dollar (USD) as traders trim USD longs ahead of the US Nonfarm Payrolls report, due later on the day. The EUR/USD pair seems to be shrugging off the previous day’s weakness and has returned above 1.1400, although it remains within the weekly range and is below 1.1435 so far.
The pair has trimmed some losses this week but maintains its broader bearish trend, following a 2% decline in June, its weakest monthly performance since July last year
The US Dollar, on the other hand, remains buoyed as a mix of strong US data and above-target inflation has prompted investors to ramp up bets on Federal Reserve (Fed) rate hikes in the coming months. In this context, the market awaits June’s Nonfarm Payrolls report to confirm those views. The consensus anticipates a 110K net increase in employment in June, following 172K in May, with the Unemployment rate steady at 4.3%.
Technical Analysis: The Euro remains on the defensive while below 1.1550
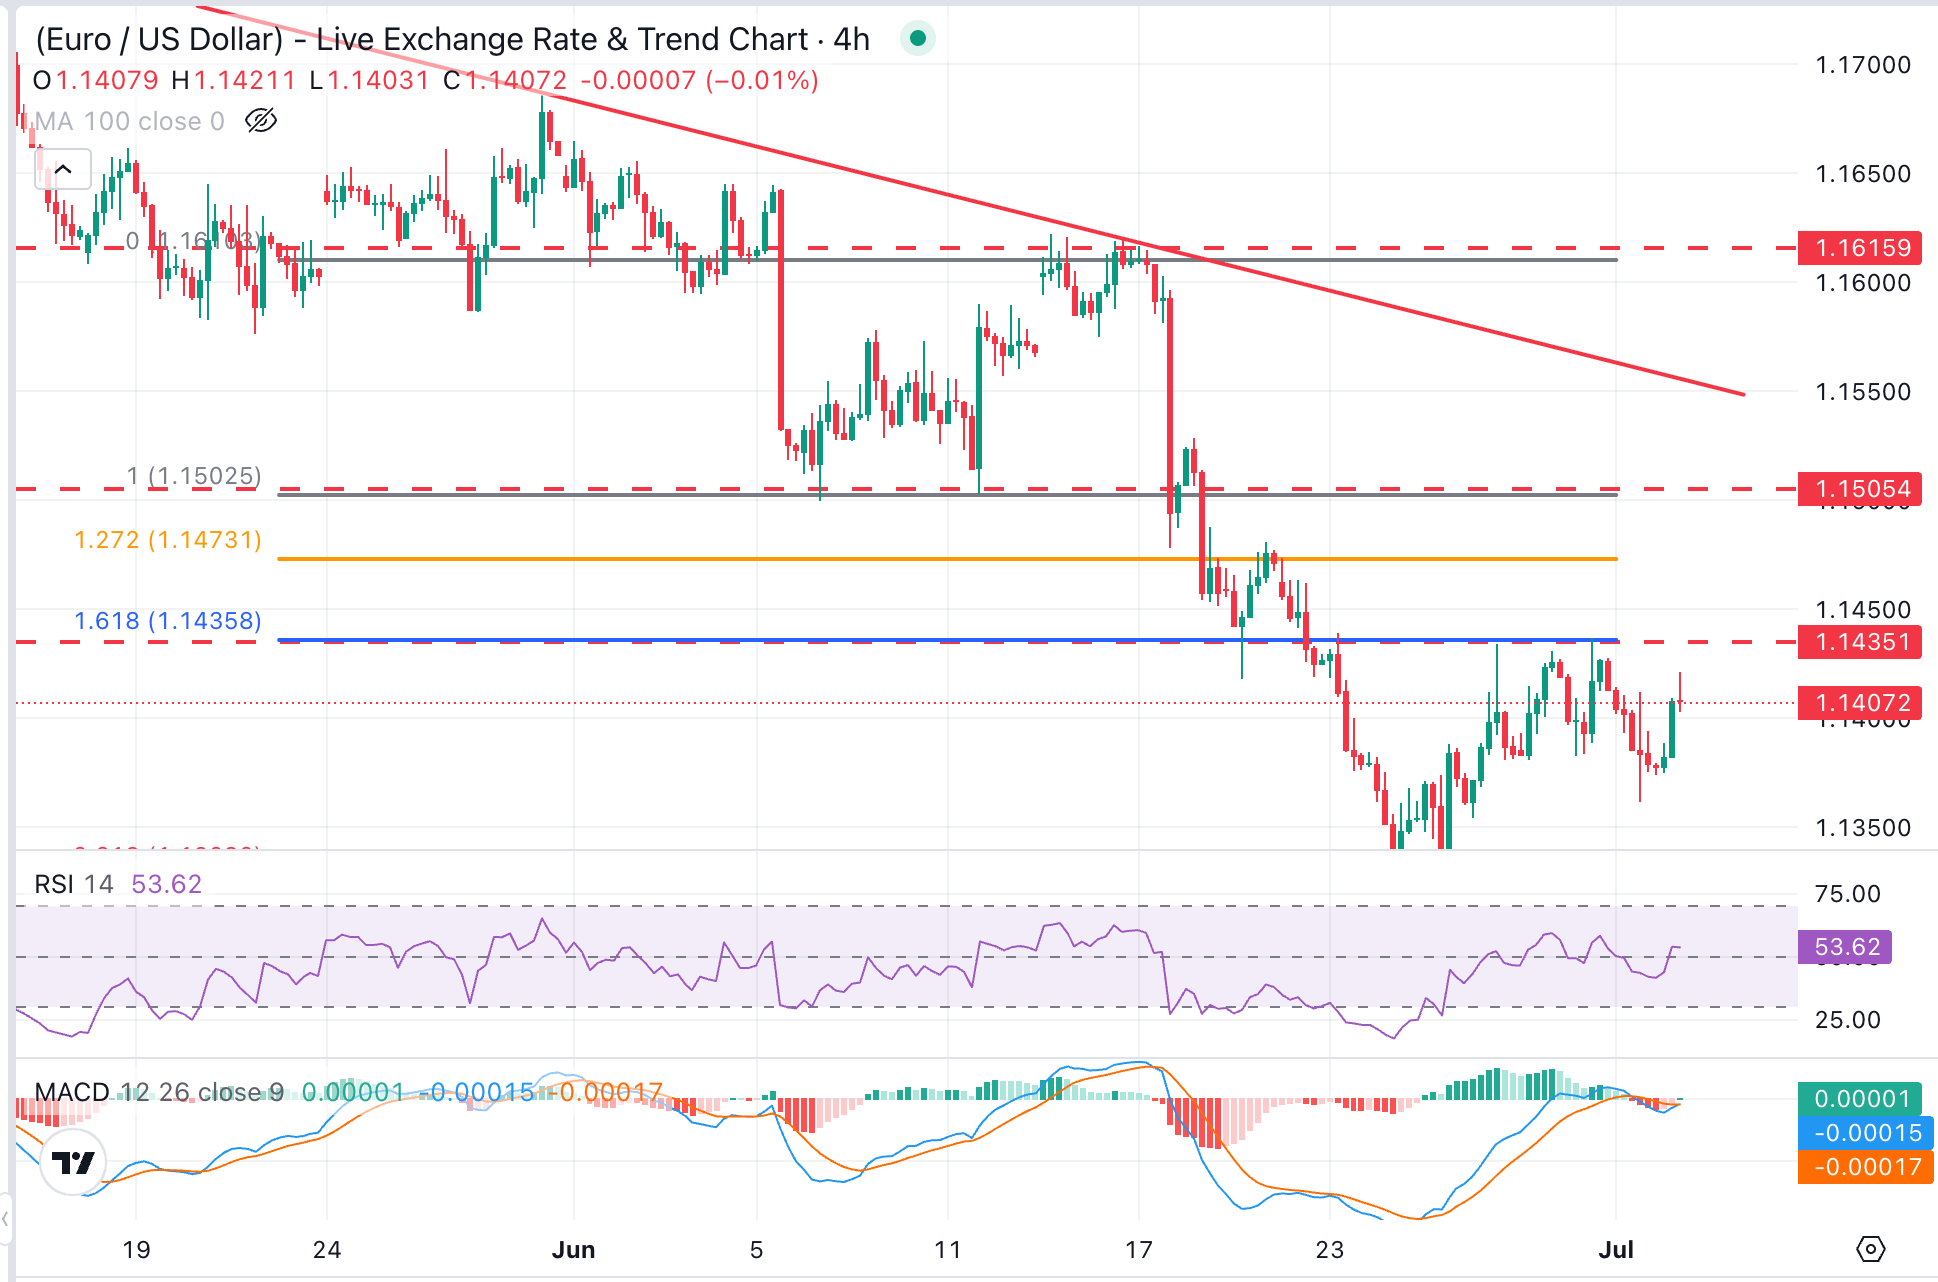
EUR/USD trades at 1.1407 but retains bearish near-term bias as the pair holds beneath a dense topside structure defined by nearby horizontal resistance at 1.1435 and the descending trendline from mid-April highs. Momentum is mildly constructive, with the four-hour Relative Strength Index (14) hovering just above the neutral 50 area, and the Moving Average Convergence Divergence (MACD) stabilizing near the zero line. These levels, however, are hinting at consolidation rather than a clear bullish reversal
Bulls would have to clear the mentioned weekly top at 1.1435 and a previous support area at the June 7 and 11 lows at 1.1505 to retest the mentioned trendline resistance, now around 1.1555, which defines the pair's bearish structure.
On the downside, Wednesday's low at 1.1360 is likely to provide some support ahead of the key 1.1324 level (June 24 low). A confirmation below here would put bears back in control and bring the area between the 316.8% Fibonacci extension of the mid-June rebound, at 1.1220, and the late May 2025 lows at 1.1210 into focus.
(The technical analysis of this story was written with the help of an AI tool.)
US Dollar Price Today
The table below shows the percentage change of US Dollar (USD) against listed major currencies today. US Dollar was the strongest against the Australian Dollar.
| USD | EUR | GBP | JPY | CAD | AUD | NZD | CHF | |
|---|---|---|---|---|---|---|---|---|
| USD | -0.29% | -0.43% | -0.77% | -0.06% | -0.06% | -0.18% | -0.48% | |
| EUR | 0.29% | -0.13% | -0.50% | 0.21% | 0.23% | 0.13% | -0.19% | |
| GBP | 0.43% | 0.13% | -0.32% | 0.33% | 0.37% | 0.27% | -0.05% | |
| JPY | 0.77% | 0.50% | 0.32% | 0.69% | 0.71% | 0.57% | 0.28% | |
| CAD | 0.06% | -0.21% | -0.33% | -0.69% | 0.01% | -0.09% | -0.41% | |
| AUD | 0.06% | -0.23% | -0.37% | -0.71% | -0.01% | -0.09% | -0.42% | |
| NZD | 0.18% | -0.13% | -0.27% | -0.57% | 0.09% | 0.09% | -0.32% | |
| CHF | 0.48% | 0.19% | 0.05% | -0.28% | 0.41% | 0.42% | 0.32% |
The heat map shows percentage changes of major currencies against each other. The base currency is picked from the left column, while the quote currency is picked from the top row. For example, if you pick the US Dollar from the left column and move along the horizontal line to the Japanese Yen, the percentage change displayed in the box will represent USD (base)/JPY (quote).
Recommended Articles


