


XRP (XRPUSD) Is up 1.05% on Jul 30: What Are the Risk Factors?
XRP (XRPUSD) is up 1.05% at Jul 30 01:45(ET), now at $1.077, with a 7-day down of 3.22%.
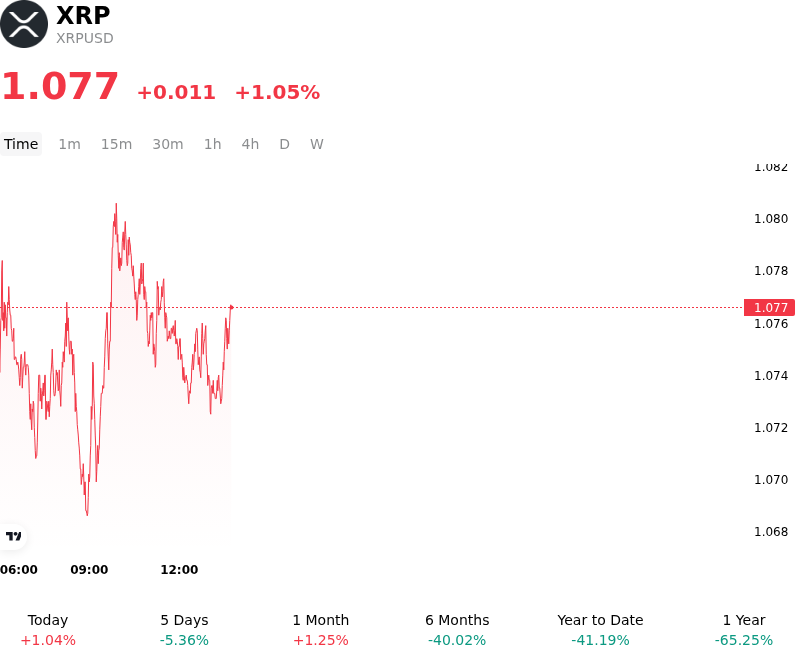
What is driving XRP (XRPUSD)’s stock price up today?
The intraday appreciation in XRP reflects a shift in institutional capital flows, largely driven by sustained demand within the spot ETF ecosystem. As professional allocators increasingly integrate digital assets into diversified portfolios, XRP has benefited from its unique positioning as a regulated utility token for cross-border liquidity. The current volatility suggests a tightening of liquid supply on major exchanges, as institutional desks absorb selling pressure from retail participants, leading to an upward repricing of the asset’s floor.
Positive sentiment is further bolstered by developments surrounding the integration of the XRP Ledger into global payment infrastructures. Market participants are reacting to reports of expanded utilization by financial institutions for real-time settlement of tokenized assets. This fundamental shift from speculative trading to utility-driven demand is altering the asset's volatility profile, as long-term holders increasingly lock up supply for staking or liquidity provision in institutional DeFi protocols.
Macroeconomic conditions remain a supportive tailwind for the broader digital asset complex. With the Federal Reserve maintaining a neutral to accommodative stance to support global liquidity, the relative weakness in the US dollar has channeled capital into high-beta assets. For XRP, this macro liquidity is being amplified by the clarity of its legal status in the United States, which has eliminated the regulatory discount that previously hampered its performance relative to other large-cap digital assets.
In the derivatives market, a spike in open interest suggests that sophisticated traders are positioning for a breakout from recent consolidation ranges. The intraday movement was characterized by a squeeze of localized short positions, which accelerated the price advance as liquidity dried up at key resistance levels. This technical positioning, combined with steady net inflows into spot products, indicates a broadening of the investor base beyond early adopters toward traditional wealth management channels.
While the immediate trend is positive, institutional investors continue to monitor global regulatory nuances, particularly regarding stablecoin interoperability and the scaling of Layer-2 solutions on the XRP Ledger. The current price action underscores the market's growing confidence in XRP’s role as a bridge currency in a fragmented financial landscape, though the asset remains sensitive to shifts in aggregate risk appetite and broader moves in the Bitcoin-led market cycle.
Technical Analysis of XRP (XRPUSD)
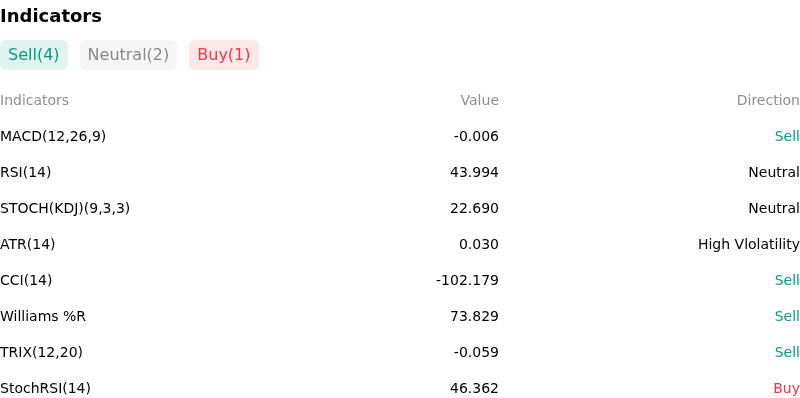
Technically, XRP (XRPUSD) shows a MACD (12,26,9) value of -0.006, indicating a sell signal. The RSI at 43.994 suggests neutral condition and the Williams %R at 73.829 suggests sell condition. Please monitor closely.
More details about XRP (XRPUSD)
Recent Events and Risks:
- SEC Appellate Litigation Overhang: The ongoing legal uncertainty following the SEC’s appeal of the Ripple ruling continues to suppress institutional confidence, as any adverse procedural movement in the Second Circuit could jeopardize the current regulatory status of XRP.
- Concentrated Whale Exchange Inflows: Recent on-chain data has flagged significant transfers of XRP from private "whale" wallets to centralized exchanges like Bitstamp and Bithumb, increasing immediate sell-side pressure and signaling potential large-scale liquidation.
- RLUSD Operational Delays: Uncertainty regarding the specific timing of the New York Department of Financial Services (NYDFS) approval for Ripple’s RLUSD stablecoin has introduced "wait-and-see" volatility, as the market re-evaluates the timeline for Ripple’s broader ecosystem expansion.
- Leverage-Induced Liquidation Risk: A recent buildup in XRP-denominated Open Interest across perpetual futures markets, coupled with tightening spot liquidity, has created a high-gamma environment where minor price dips could trigger a cascade of forced long liquidations.
Recommended Articles


