


Ethereum (ETHUSD) Fluctuated Significantly on Jul 30: Key Variables Behind the Move
Ethereum (ETHUSD) is up 1.29% at Jul 30 00:05(ET), now at $1905.93, with a 7-day up of 1.19%.
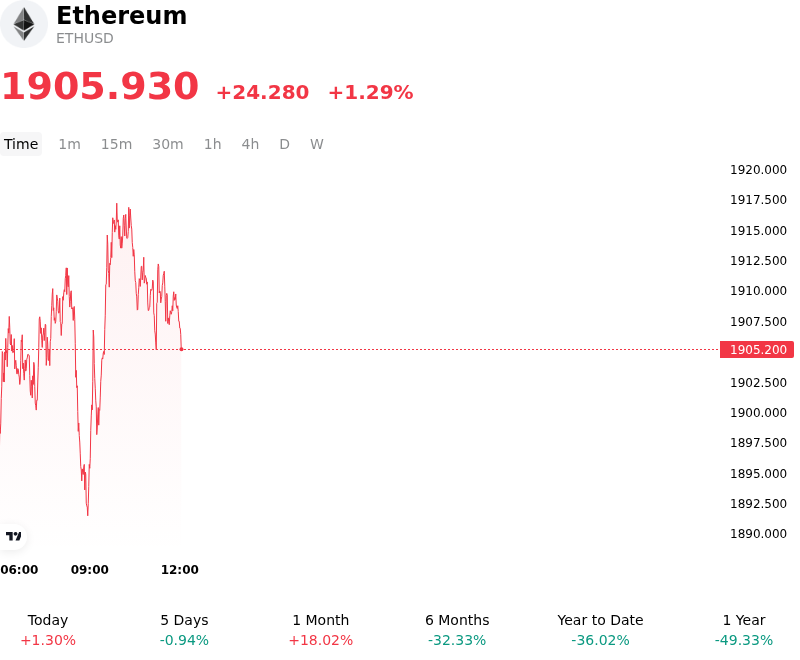
What is driving Ethereum (ETHUSD)’s stock price up today?
The upward movement in Ethereum is primarily driven by sustained institutional accumulation through spot ETH ETFs and a favorable shift in global macro liquidity. As institutional investors increasingly view the network as the primary infrastructure for the tokenization of real-world assets, capital flows have concentrated on Ethereum as a core portfolio component. The recent stabilization in net inflows suggests that professional asset managers are rotating back into high-conviction digital assets following a period of macroeconomic uncertainty.
Monetary policy expectations are playing a critical role in the current price action. A softening in the US Dollar, coupled with a slight decline in long-term Treasury yields, has improved the risk-reward profile for non-yielding and yield-bearing digital assets alike. With the Federal Reserve signaling a more neutral to accommodative stance, the opportunity cost of holding Ethereum has diminished, encouraging a broader risk-on sentiment across the digital asset class. This macro backdrop is particularly beneficial for Ethereum, which markets increasingly value as a hybrid between a technology platform and a digital commodity.
On-chain dynamics further reinforce the bullish sentiment, as the supply of Ethereum on exchanges continues to reach multi-year lows. The prevalence of staking activity and the migration of capital to Layer-2 ecosystems have effectively reduced liquid supply, creating a supply-demand imbalance that amplifies price sensitivity to positive news. Furthermore, the growth in decentralized finance protocols and the deployment of enterprise-grade smart contracts provide a fundamental floor for valuation, as network utility translates into consistent demand for gas.
Market structure and derivatives positioning have also contributed to the intraday strength. A steady increase in open interest, combined with positive funding rates, indicates that institutional traders are re-leveraging in anticipation of further network growth. The lack of significant sell-side pressure from large wallets suggests that long-term holders are maintaining their positions, reflecting a broader structural trend rather than a fleeting speculative spike. As regulatory frameworks become clearer, the reduction in jurisdictional risk is allowing for more aggressive participation from traditional financial institutions, further stabilizing the asset's upward trajectory.
Technical Analysis of Ethereum (ETHUSD)
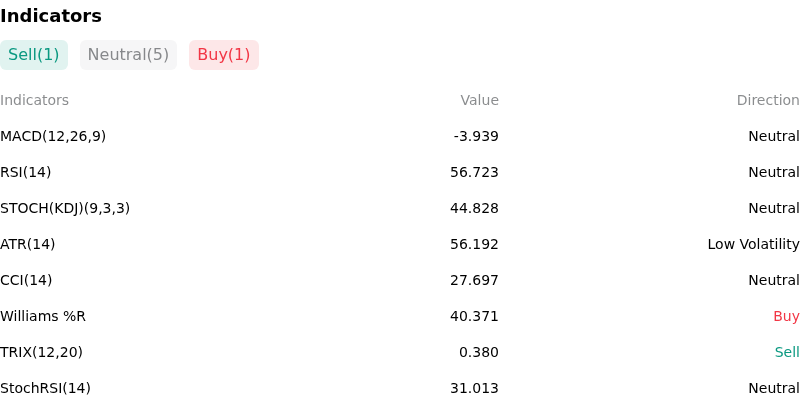
Technically, Ethereum (ETHUSD) shows a MACD (12,26,9) value of -3.708, indicating a neutral signal. The RSI at 56.901 suggests neutral condition and the Williams %R at 39.353 suggests buy condition. Please monitor closely.
More details about Ethereum (ETHUSD)
Recent Events and Risks:
- Institutional ETF Outflow Pressure: Persistent net outflows from high-fee Ethereum investment vehicles, specifically the Grayscale Ethereum Trust (ETHE), have created a significant liquidity overhang that continues to outpace organic buy-side demand from new spot ETF products, leading to sustained downward price pressure.
- Deflationary Mechanism Reversal: Following the implementation of EIP-4844, the migration of transaction volume to Layer 2 solutions has resulted in a multi-month low for Mainnet gas fees, causing the ETH supply to become inflationary and undermining the "ultrasound money" narrative that previously supported the asset's valuation premium.
- Regulatory Staking Uncertainty: Ongoing legal challenges and SEC scrutiny regarding "staking-as-a-service" and the decentralization status of Liquid Staking Tokens (LSTs) create a persistent regulatory risk premium, potentially deterring institutional participation in Ethereum's yield-bearing ecosystem.
- ETH/BTC Technical Breakdown: The Ethereum-to-Bitcoin (ETH/BTC) ratio has recently breached critical multi-year support levels, signaling a structural rotation of capital toward Bitcoin and triggering technical liquidation clusters that exacerbate intraday volatility during broader market corrections.
Recommended Articles


