


Goldman Sachs Group Inc Stock (GS) Moved Down by 3.93% on Jul 29: Facts Behind the Movement
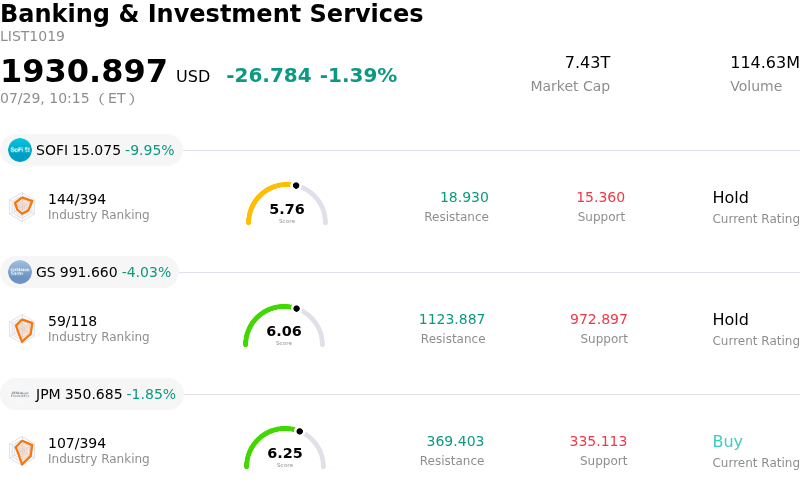
Goldman Sachs Group Inc (GS) moved down by 3.93%. The Banking & Investment Services sector is down by 1.39%. The company underperformed the industry. Top 3 stocks by turnover in the sector: SoFi Technologies Inc (SOFI) down 9.95%; Goldman Sachs Group Inc (GS) down 3.93%; JPMorgan Chase & Co (JPM) down 1.85%.
What is driving Goldman Sachs Group Inc (GS)’s stock price down today?
The downward pressure on Goldman Sachs reflects broader market anxieties regarding the Federal Reserve's latest policy stance and its implications for the financial sector. Institutional investors are currently recalibrating their expectations for net interest margins as the yield curve undergoes a period of significant adjustment. Given the firm's heavy reliance on capital market liquidity, any signal that high borrowing costs will persist longer than anticipated tends to suppress trading volumes and weigh on the bank's short-term valuation. This macroeconomic backdrop has fostered a risk-off environment, particularly affecting high-beta financial stocks.
Sector-specific concerns are also playing a critical role in the current performance. Recent industry data suggests a cooling in the initial public offering and merger and acquisition pipelines, areas where the firm traditionally holds a dominant market share. While the bank has made strides in diversifying its revenue streams into asset and wealth management, its core profitability remains deeply tethered to the health of global deal-making. The absence of a robust recovery in corporate activity has led several institutional desks to trim their exposure during this period of heightened volatility.
Furthermore, shifting regulatory requirements regarding capital adequacy and operational risk are creating a layer of uncertainty for global systemically important banks. Investors are closely scrutinizing potential increases in capital buffers, which could limit the bank’s flexibility in returning cash to shareholders through buybacks and dividends. These headwinds are compounded by a cautious outlook on credit quality within the broader financial landscape, as prolonged interest rate pressures begin to strain corporate balance sheets and elevate the potential for credit loss provisions.
Market sentiment is currently characterized by elevated volatility, as reflected in the recent movements of the VIX. For an institution that thrives on market stability and predictable capital flows, the current environment of intraday turbulence represents a significant operational hurdle. Analysts have begun adjusting their near-term forecasts to account for these tightening financial conditions and regulatory risks, resulting in the selling pressure observed throughout the session. The convergence of macro uncertainty and industry-specific headwinds continues to challenge the stock's upward momentum in the near term.
Technical Analysis of Goldman Sachs Group Inc (GS)
Technically, Goldman Sachs Group Inc (GS) shows a MACD (12,26,9) value of -12.626, indicating a neutral signal. The RSI at 45.110 suggests neutral condition and the Williams %R at 84.890 suggests oversold condition. Please monitor closely.
Media Coverage of Goldman Sachs Group Inc (GS)
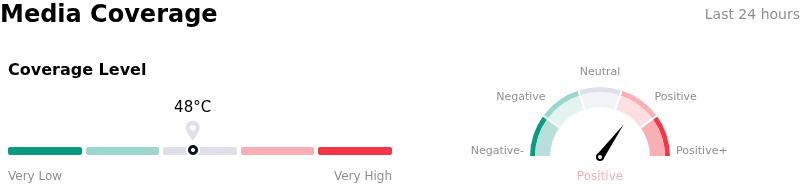
In terms of media coverage, Goldman Sachs Group Inc (GS) shows a coverage score of 48, indicating a moderate level of media attention. The overall market sentiment index is currently in bullish zone.
Fundamental Analysis of Goldman Sachs Group Inc (GS)
Goldman Sachs Group Inc (GS) is in the Banking & Investment Services industry. Its latest annual revenue is $117.10B, ranking 2 in the industry. The net profit is $16.30B, ranking 1 in the industry. Company Profile
Over the past month, multiple analysts have rated the company as Hold, with an average price target of $1173.22, a high of $1325.00, and a low of $995.00.
More details about Goldman Sachs Group Inc (GS)
Company Specific Risks:
- Regulatory Scrutiny of Transaction Banking: The Federal Reserve and other regulators have intensified investigations into Goldman Sachs’ Transaction Banking (TxB) unit regarding insufficient due diligence and risk management protocols for fintech partners, threatening potential fines and operational curbs.
- Delayed Investment Banking Recovery: Recent executive commentary citing a "higher-for-longer" interest rate environment has cooled institutional expectations for a near-term surge in M&A and IPO volumes, creating downside pressure on the firm's core fee-generating segments.
- Commercial Real Estate (CRE) Impairments: The firm remains vulnerable to further valuation write-downs within its alternative investment portfolio due to its concentrated exposure to the underperforming office-sector commercial real estate market, which continues to suffer from high vacancy rates and refinancing stress.
- Consumer Exit Execution Risks: The ongoing and complex dissolution of the credit card partnership with Apple and the offloading of remaining GreenSky assets introduce significant execution risks, with analysts flagging the potential for additional non-cash impairment charges and platform transition costs.
Recommended Articles


