


Ferguson Enterprises Inc Stock (FERG) Moved Down by 3.58% on Jul 29: A Full Analysis
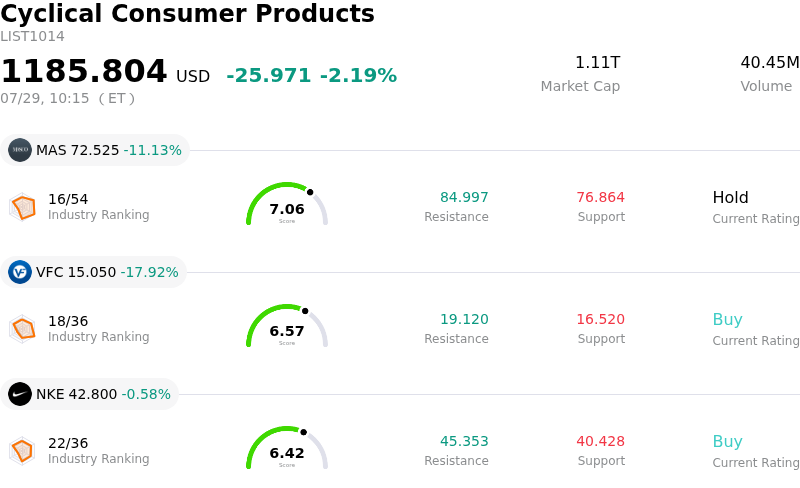
Ferguson Enterprises Inc (FERG) moved down by 3.58%. The Cyclical Consumer Products sector is down by 2.19%. The company underperformed the industry. Top 3 stocks by turnover in the sector: Masco Corp (MAS) down 11.08%; VF Corp (VFC) down 17.92%; Nike Inc (NKE) down 0.58%.
What is driving Ferguson Enterprises Inc (FERG)’s stock price down today?
The downward pressure on Ferguson's shares is primarily driven by a confluence of macroeconomic data indicating a persistent cooling in the North American construction and renovation markets. As a leading distributor of plumbing, heating, and infrastructure products, Ferguson's performance is closely tied to the health of residential housing starts and non-residential project completions. Recent indicators suggesting a slowdown in new building permits and a decline in residential investment have dampened investor expectations for organic volume growth in the coming quarters.
Intraday volatility has been exacerbated by cautious commentary from major industry analysts who have revised their outlooks for the industrial distribution sector. These adjustments reflect concerns that the prolonged high-interest-rate environment is finally stifling demand in the repair and remodel segment, which has historically been a resilient source of revenue for the company. With consumer discretionary spending tightening, large-scale home improvement projects are being deferred, leading to a more challenging environment for Ferguson’s high-margin residential business.
From an institutional perspective, the market is reacting to potential margin compression resulting from increased competition and shifting inventory dynamics. As supply chain constraints have largely eased, the industry is moving from a period of inventory accumulation to one of de-stocking. This transition often leads to intensified pricing competition among distributors looking to maintain market share, which can erode gross margins. Institutional investors appear to be re-balancing their portfolios away from cyclical construction-linked assets in favor of more defensive sectors until there is clearer evidence of a bottoming out in the housing cycle.
Furthermore, the broader market sentiment remains sensitive to regional economic data that suggests a softening in non-residential construction activity. While long-term tailwinds such as domestic manufacturing reshoring and infrastructure legislation remain intact, the immediate outlook is clouded by budgetary constraints and project delays. The current price movement reflects a recalibration of valuation multiples as the market accounts for these operational risks and the possibility of more conservative earnings guidance in the next reporting cycle.
In the near term, Ferguson remains exposed to fluctuations in commodity prices and currency shifts, which add layers of complexity to its cost structure. While the company’s strong balance sheet and history of strategic acquisitions provide a degree of stability, the prevailing narrative is dominated by the cyclical downturn in its core end-markets. Without a catalyst such as a significant shift in monetary policy or a surprise rebound in housing data, the stock is likely to experience continued volatility as investors weigh the timing of a potential recovery against current fundamental headwinds.
Technical Analysis of Ferguson Enterprises Inc (FERG)
Technically, Ferguson Enterprises Inc (FERG) shows a MACD (12,26,9) value of 0.816, indicating a neutral signal. The RSI at 51.056 suggests neutral condition and the Williams %R at 34.348 suggests buy condition. Please monitor closely.
Fundamental Analysis of Ferguson Enterprises Inc (FERG)
Ferguson Enterprises Inc (FERG) is in the Cyclical Consumer Products industry. Its latest annual revenue is $12.83B, ranking 6 in the industry. The net profit is $786.00M, ranking 8 in the industry. Company Profile
Over the past month, multiple analysts have rated the company as Buy, with an average price target of $289.10, a high of $454.55, and a low of $204.56.
More details about Ferguson Enterprises Inc (FERG)
Company Specific Risks:
- Organic Revenue Contraction: Recent financial reports indicate a sustained decline in organic revenue, primarily driven by a slowdown in the U.S. residential segment and lower volumes in new construction projects.
- Commodity Price Deflation: The company is facing significant headwinds from price deflation in core product categories, such as piping and tubing, which is eroding top-line growth and challenging the maintenance of historical gross margins.
- High Sensitivity to Interest Rates: Institutional analysts have highlighted an increased vulnerability to the "higher-for-longer" interest rate environment, which continues to suppress demand in the critical Repair, Maintenance, and Improvement (RMI) market.
- Operational Deleveraging Risks: As volume growth remains stagnant, there is an elevated risk of margin compression due to operational deleveraging, where fixed costs exert greater pressure on earnings despite ongoing cost-saving initiatives.
Recommended Articles


