


Brent (UKOIL) Is up 4.11% on Jul 29: Why It Happened
Brent (UKOIL) is up 4.11% at Jul 29 00:15(ET), now at $84.94, with a 7-day down of 8.05%.
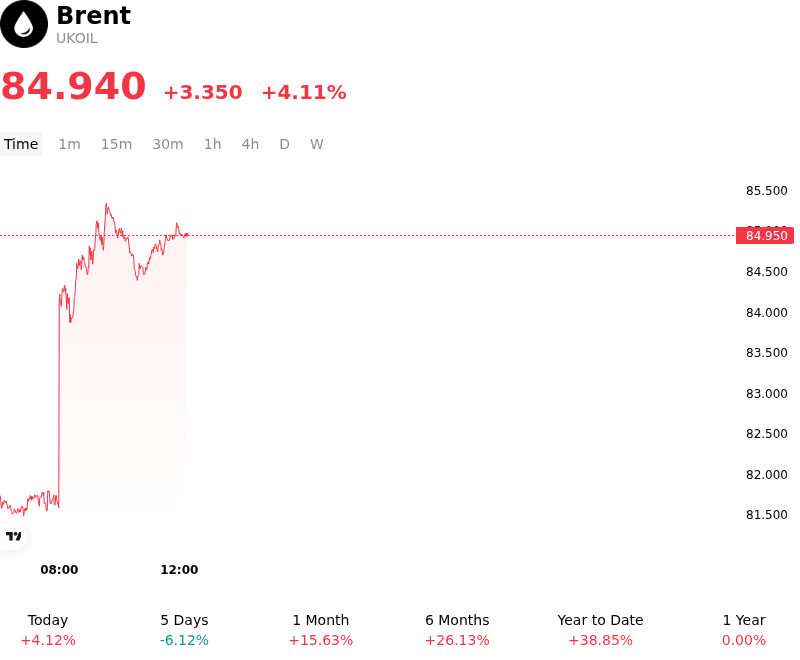
What is driving Brent (UKOIL)’s stock price up today?
The sharp appreciation in Brent crude prices is primarily driven by a confluence of tightening physical market indicators and heightened geopolitical risk premiums. The most immediate catalyst was the U.S. Energy Information Administration’s weekly status report, which revealed a significantly larger-than-anticipated drawdown in commercial crude inventories. This depletion, which far exceeded seasonal norms, suggests that refinery throughput remains robust while domestic production growth has struggled to keep pace with resilient summer cooling and transportation demand.
Furthermore, supply-side anxieties have been amplified by escalating tensions in key oil-producing regions, specifically reports of new disruptions to maritime traffic in critical transit corridors. Institutional investors have reacted to these developments by pricing in a higher probability of prolonged supply constraints, leading to a rapid unwinding of short positions. The resulting short squeeze has added momentum to the upward price trajectory as systematic trend-following funds reposition for a tighter market balance in the second half of the year.
Macroeconomic factors have also provided a tailwind for energy markets. The conclusion of the latest Federal Reserve policy meeting signaled a more accommodative stance than previously anticipated, weighing on the U.S. dollar. As crude oil is priced in dollars, the currency’s depreciation has increased the purchasing power of international buyers, further stimulating demand expectations. The shift in interest rate expectations has also bolstered a broader risk-on sentiment across commodity complexes, as investors anticipate lower borrowing costs will support industrial activity and long-term energy consumption.
Looking ahead, the market remains highly sensitive to upcoming OPEC+ ministerial guidance. Current price action reflects a growing consensus that the alliance will maintain its disciplined production targets rather than aggressively returning barrels to the market. While technical indicators suggest the rally may be entering overbought territory, the structural deficit indicated by falling global inventories and the lack of significant spare capacity outside of the core OPEC group continue to provide a firm floor for Brent prices. Risks remain skewed to the upside if geopolitical volatility continues to threaten infrastructure or if manufacturing PMIs in major consuming economies show further signs of recovery.
Technical Analysis of Brent (UKOIL)
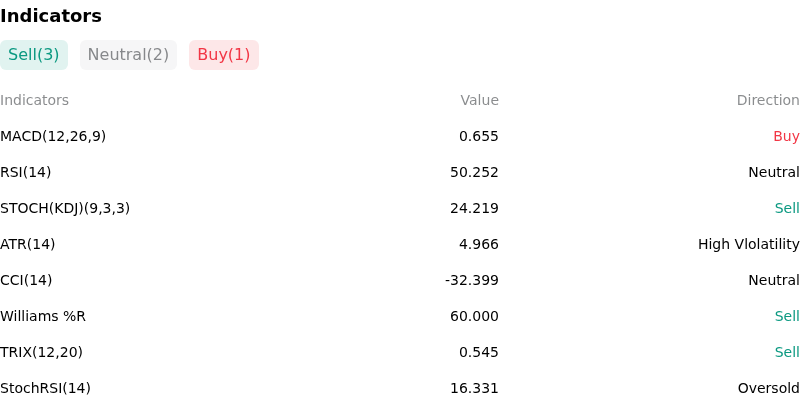
Technically, Brent (UKOIL) shows a MACD (12,26,9) value of 0.655, indicating a buy signal. The RSI at 50.252 suggests neutral condition and the Williams %R at 60.000 suggests sell condition. Please monitor closely.
More details about Brent (UKOIL)
Recent Events and Risks:
- OPEC+ Supply Phase-In Uncertainty: Market sentiment remains fragile following the OPEC+ decision to outline a roadmap for tapering 2.2 million barrels per day of voluntary production cuts starting in October 2024, leading to fears of a supply surplus in a market already struggling with lackluster demand.
- Waning Chinese Industrial Demand: Recent manufacturing PMI data from China has signaled a contraction in factory activity, raising significant concerns among commodity strategists regarding the crude consumption growth rate of the world’s largest oil importer for the remainder of the year.
- Bearish US Inventory Data: Latest reports from the Energy Information Administration (EIA) indicated an unexpected build in gasoline inventories and a rise in commercial crude stocks, suggesting that the peak summer driving season in the United States is failing to generate the anticipated drawdown in supplies.
- Geopolitical Risk Premium Deflation: Ongoing diplomatic efforts and potential ceasefire negotiations in the Middle East have led to a "de-risking" phase among traders, resulting in the liquidation of long positions as the immediate threat to regional oil infrastructure and transit routes appears to have temporarily subsided.
Recommended Articles


