


Brent Futures (UKOIL-F) Is up 4.13% on Jul 29: Why It Happened
Brent Futures (UKOIL-F) is up 4.13% at Jul 29 00:10(ET), now at $85.14, with a 7-day down of 9.27%.
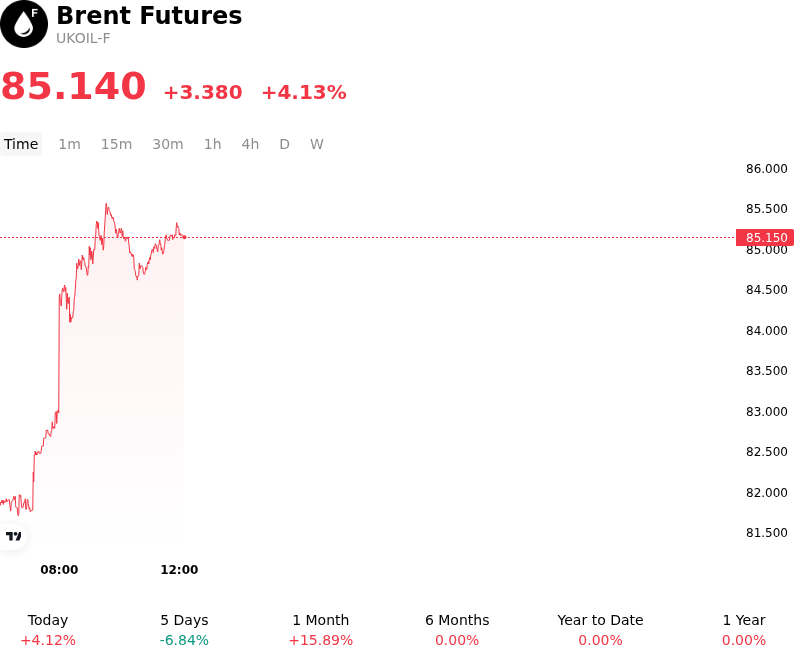
What is driving Brent Futures (UKOIL-F)’s stock price up today?
The primary catalyst for the surge in Brent crude prices is a combination of significantly tighter-than-expected physical market conditions and escalating geopolitical risks in key transit corridors. The U.S. Energy Information Administration's weekly report revealed a massive drawdown in crude inventories, far exceeding consensus estimates. This depletion of commercial stocks during the peak summer driving season highlights a structural deficit in the Atlantic Basin, forcing refiners to compete aggressively for available spot barrels and driving the prompt spread into deeper backwardation.
Simultaneously, supply-side anxieties have been amplified by renewed disruptions in the Middle East. Reports of intensified maritime security threats affecting tanker transit have triggered a significant risk premium repricing. As traders account for potential delays in global oil flows through critical chokepoints, the market is pricing in a higher probability of sustained supply interruptions, which immediately forces a sharp upward adjustment in front-month futures.
Macroeconomic tailwinds are also playing a critical role in the current price action. Expectations for a more accommodative monetary policy stance following recent central bank commentary have pressured the U.S. dollar, making greenback-denominated commodities more attractive to international buyers. As the market anticipates a potential shift toward lower interest rates, the resulting dollar weakness is providing a secondary lift to the energy complex while bolstering global demand expectations for the second half of the year.
Furthermore, OPEC+ remains steadfast in its production management strategy. The alliance’s continued adherence to voluntary output cuts has successfully offset recent increases in non-OPEC supply, effectively tightening the global market balance. This disciplined approach, coupled with signs of stabilizing manufacturing activity in major emerging markets, has shifted the investor narrative toward a deficit-driven outlook for the remainder of the quarter.
From a technical perspective, the sharp move suggests a breakout from recent trading ranges, likely triggering systematic buy orders and significant short-covering from institutional participants. While the rally is supported by robust fundamental drivers, investors continue to monitor the durability of demand growth and the potential for a sudden de-escalation in geopolitical tensions. For now, however, the confluence of low inventories, supply-side vulnerability, and a favorable macroeconomic backdrop continues to support higher pricing levels for the global benchmark.
Technical Analysis of Brent Futures (UKOIL-F)
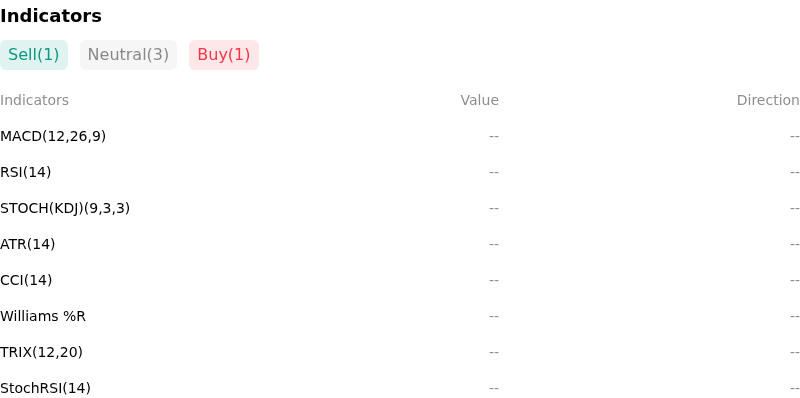
Technically, Brent Futures (UKOIL-F) shows a MACD (12,26,9) value of 4.073, indicating a buy signal. The RSI at 49.428 suggests neutral condition and the Williams %R at 50.818 suggests neutral condition. Please monitor closely.
More details about Brent Futures (UKOIL-F)
Recent Events and Risks:
- Geopolitical Risk Premium Erosion: Continued diplomatic efforts and the U.S.-backed "bridging proposal" for a Gaza ceasefire have significantly reduced the perceived risk of a regional supply disruption, leading to a sharp unwinding of long positions as the war premium fades from Brent pricing.
- Persistent Chinese Demand Weakness: Recent data indicating a slump in Chinese refinery margins and a year-on-year decline in crude imports has heightened concerns that the world's largest importer is facing a structural slowdown, exacerbated by the rapid domestic adoption of LNG-powered trucks and electric vehicles.
- OPEC+ Production Uncertainty: Market participants are increasingly concerned that OPEC+ may proceed with scheduled production increases starting in October despite a softening price environment, creating a potential supply surplus that threatens to overwhelm modest global demand growth.
- Bearish Inventory Signals: Recent industry reports and U.S. EIA data showing unexpected builds in commercial crude stocks, alongside rising production levels from non-OPEC sources like the U.S., Guyana, and Brazil, are exerting downward pressure on the front-month futures spread.
Recommended Articles


