


Bitcoin (BTCUSD) Is up 1.04% on Jul 27: What Do On-Chain Data and Market Sentiment Show?
Bitcoin (BTCUSD) is up 1.04% at Jul 27 00:15(ET), now at $65288.52, with a 7-day down of 0.08%.
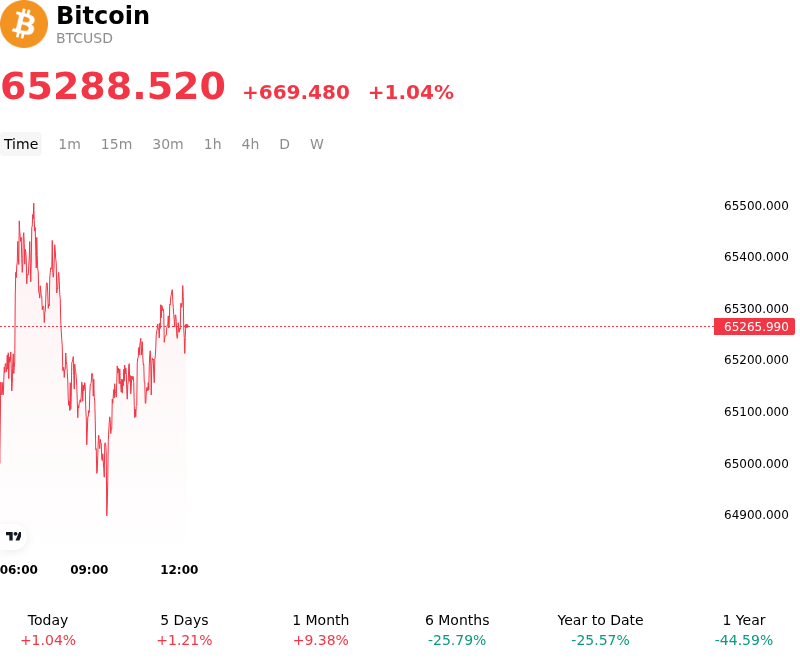
What is driving Bitcoin (BTCUSD)’s stock price up today?
Bitcoin's upward momentum during the current session is primarily attributed to a sustained acceleration in net inflows across the spot ETF complex, signaling a shift in institutional capital allocation as wealth managers continue to integrate digital assets into diversified portfolios. This demand is further amplified by a tightening supply environment on centralized exchanges, where liquid reserves have reached multi-year lows, creating a supply-demand imbalance that rewards even modest increases in buy-side pressure.
Macroeconomic tailwinds are providing additional support for the asset. A slight softening in the US Dollar Index, coupled with stabilizing long-duration Treasury yields, has improved risk appetite across the broader financial landscape. Investors are increasingly viewing Bitcoin as a crucial hedge against fiscal expansion and potential currency debasement, a narrative that continues to gain traction as global sovereign debt levels remains a focal point for macro strategists.
In the derivatives market, the price action has triggered a series of liquidations of short positions, providing mechanical fuel for the intraday advance. The increase in open interest on regulated platforms like the CME suggests that sophisticated participants are adding long exposure, likely in anticipation of a favorable shift in global liquidity conditions. This positioning reflects a growing consensus that the structural floor for Bitcoin has moved higher, supported by institutional custody solutions and clearer regulatory frameworks.
On-chain metrics indicate that long-term holders remain in a phase of accumulation, significantly reducing the sell-side liquidity available to the market. The lack of significant profit-taking at these levels suggests that large-scale investors are targeting higher valuation milestones, viewing the current price levels as an attractive entry point within a broader structural uptrend. Furthermore, the continued development of Bitcoin-native scaling solutions has fortified the fundamental case for the asset, attracting capital from sectors focused on blockchain infrastructure and security.
While the immediate trend is positive, institutional investors remain vigilant regarding upcoming Federal Reserve communications and potential shifts in global regulatory oversight. The current volatility serves as a reminder of the market's sensitivity to liquidity conditions, but the overarching theme remains one of institutional consolidation and the maturation of Bitcoin as a core global alternative asset class.
Technical Analysis of Bitcoin (BTCUSD)
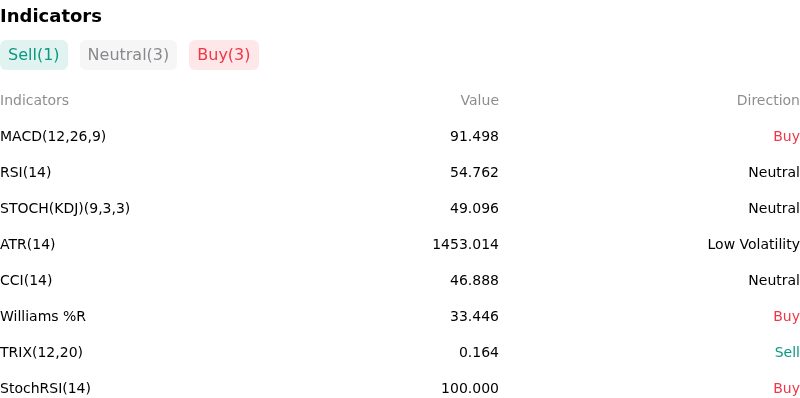
Technically, Bitcoin (BTCUSD) shows a MACD (12,26,9) value of 91.498, indicating a buy signal. The RSI at 54.762 suggests neutral condition and the Williams %R at 33.446 suggests buy condition. Please monitor closely.
More details about Bitcoin (BTCUSD)
Recent Events and Risks:
- Spot ETF Net Outflows: Recent institutional trading data indicates a shift toward net outflows across several US-based Spot Bitcoin ETFs, including sustained exits from the Grayscale Bitcoin Trust (GBTC), which diminishes immediate buy-side support and signals a cooling of institutional demand.
- Long Liquidation Clusters: Exchange heatmaps show a significant concentration of leveraged long positions clustered just below current support levels, creating the risk of a rapid, cascading price drop should a localized volatility spike trigger automated liquidations.
- Miner Capitulation Trends: On-chain metrics track increased transfers from miner-affiliated wallets to centralized exchanges, suggesting that mining operations are liquidating BTC holdings to cover elevated operational costs following the recent block reward halving, adding to overhead sell pressure.
- Macro-Driven De-risking: A recent rebound in the US Dollar Index (DXY) combined with hawkish rhetoric from Federal Reserve officials regarding "higher-for-longer" interest rates has intensified risk-off sentiment, leading to capital rotation out of volatile digital assets and into traditional safe havens.
Recommended Articles


