


Solana (SOLUSD) Suddenly Goes up 1.59% on Jul 27: What You Need to Watch
Solana (SOLUSD) is up 1.59% at Jul 27 00:05(ET), now at $75.52, with a 7-day down of 1.77%.
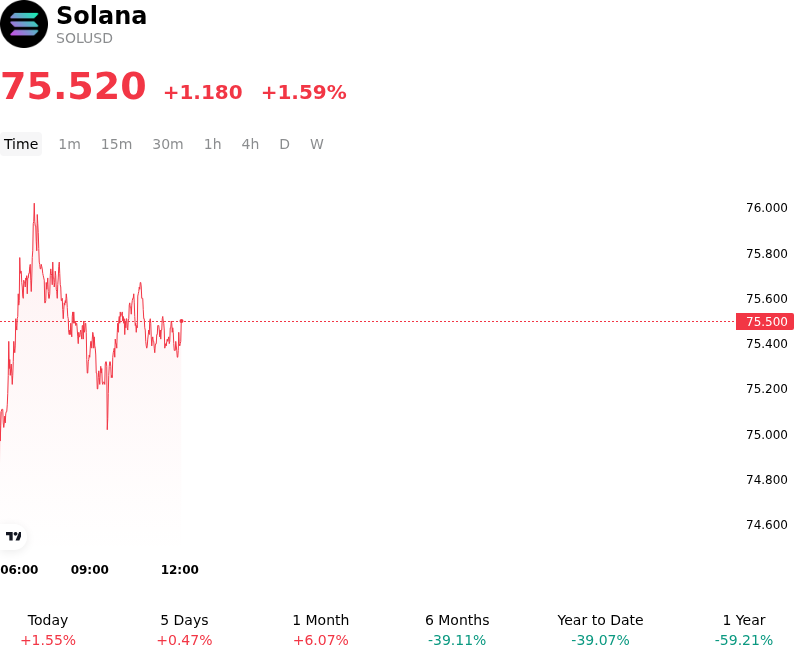
What is driving Solana (SOLUSD)’s stock price up today?
The recent appreciation in Solana is primarily attributed to a sustained acceleration in institutional capital inflows, specifically directed through spot Solana ETF products that have seen increased daily net subscriptions. This trend reflects a broadening institutional consensus that Solana represents the premier high-throughput monolithic blockchain, serving as a viable alternative to the Ethereum ecosystem for decentralized finance and enterprise-grade tokenization. As market participants recalibrate their portfolios for the second half of 2026, Solana’s ability to maintain high network uptime and transaction speeds has solidified its status as a core allocation within digital asset strategies.
Macroeconomic conditions have provided a supportive backdrop for this move, as cooling inflation data has led to a stabilization in long-dated U.S. Treasury yields. This environment has encouraged a rotation back into high-beta risk assets. The U.S. dollar’s relative weakness against a basket of major currencies has further improved global liquidity conditions, lowering the hurdle rate for speculative and institutional capital to enter the digital asset space. Solana, characterized by its high sensitivity to liquidity cycles, has outperformed broader market benchmarks as investors seek exposure to scalable infrastructure.
On-chain metrics indicate a significant uptick in the deployment of real-world assets (RWAs) and institutional stablecoin issuance on the Solana mainnet. The maturation of the Firedancer validator client has significantly mitigated historical concerns regarding network stability, fostering a more robust environment for large-scale financial applications. This technical evolution has incentivized traditional financial institutions to move beyond pilot programs into active deployment, creating a structural bid for the underlying token to facilitate transaction costs and staking requirements.
Derivatives market positioning also played a tactical role in the recent price action. A cluster of short liquidations occurred as the price breached key psychological resistance levels, providing the necessary momentum to absorb intraday sell pressure. The open interest in Solana futures remains elevated, suggesting that while the current advance is supported by spot demand, the market remains susceptible to volatility driven by leveraged positioning.
Despite the positive momentum, institutional investors continue to monitor the evolving regulatory landscape, particularly concerning the classification of staking-as-a-service and the long-term decentralization of the validator set. While the current trend reflects a structural shift toward institutional adoption, the inherent volatility of the asset class requires a focus on liquidity depth and execution risk. The move today suggests that Solana is increasingly decoupling from the general altcoin market, driven by its unique ecosystem growth and clear institutional utility.
Technical Analysis of Solana (SOLUSD)
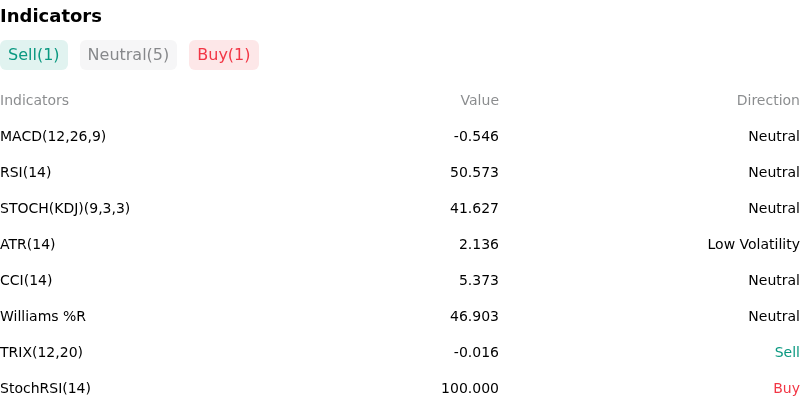
Technically, Solana (SOLUSD) shows a MACD (12,26,9) value of -0.546, indicating a neutral signal. The RSI at 50.573 suggests neutral condition and the Williams %R at 46.903 suggests neutral condition. Please monitor closely.
More details about Solana (SOLUSD)
Recent Events and Risks:
- Regulatory and ETF Classification Risk: Market uncertainty persists regarding Solana's legal status following the SEC’s prior classification of SOL as a security in enforcement actions; this creates a significant hurdle for spot ETF approval and may lead to a capital rotation out of SOL and into assets with clearer regulatory pathways, such as Ethereum.
- Supply Overhang from Estate Liquidations: On-chain monitoring of wallets associated with the FTX and Alameda Research bankruptcy estates continues to reveal periodic large-scale transfers to exchanges, sustaining fears of sudden sell-side pressure that could outpace current market depth and trigger localized liquidation cascades.
- Network Performance and Congestion Vulnerabilities: Despite recent software upgrades, the network remains susceptible to intermittent congestion and high transaction failure rates during periods of extreme meme-coin volatility, posing a risk to decentralized finance (DeFi) protocols that rely on timely oracle updates and liquidations.
- Macro-Driven De-risking: As a high-beta asset, Solana is experiencing heightened downside sensitivity to hawkish signals from central banks; recent shifts toward "higher-for-longer" interest rate expectations have pressured speculative positions, increasing the likelihood of sharp intraday drawdowns if broader risk-off sentiment intensifies.
Recommended Articles


