


Ge Vernova Inc Stock (GEV) Moved Down by 6.14% on Jul 22: Drivers Behind the Movement
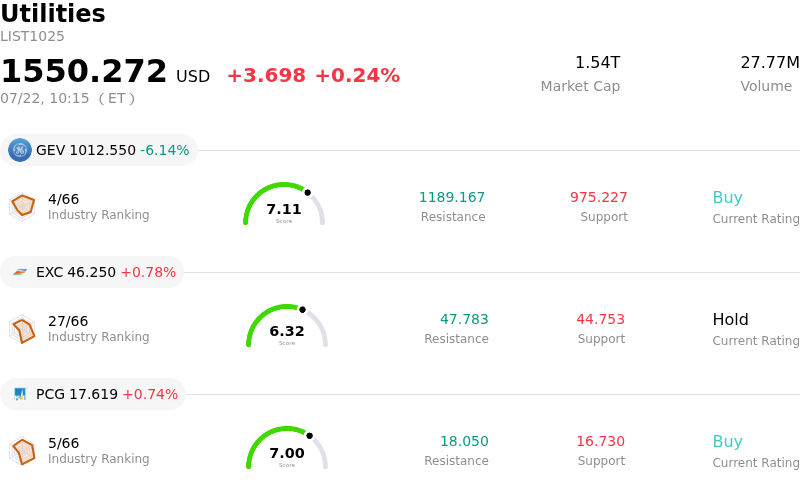
Ge Vernova Inc (GEV) moved down by 6.14%. The Utilities sector is up by 0.24%. The company underperformed the industry. Top 3 stocks by turnover in the sector: Ge Vernova Inc (GEV) down 6.14%; Exelon Corp (EXC) up 0.78%; PG&E Corp (PCG) up 0.74%.
What is driving Ge Vernova Inc (GEV)’s stock price down today?
GE Vernova’s recent downward movement is primarily driven by a disappointing second-quarter earnings report that failed to meet institutional expectations regarding margin expansion in the offshore wind segment. While revenue in the Power and Electrification divisions remains relatively stable, persistent inflationary pressures on raw materials and logistical bottlenecks have continued to compress profitability in the renewable energy division. This earnings miss, coupled with a cautious downward revision of full-year EBITDA guidance, has sparked concerns among investors about the company’s ability to achieve its long-term margin targets in an increasingly competitive global market.
The downturn is further exacerbated by broader industry headwinds affecting the clean energy transition. Regulatory delays and grid connection backlogs in major markets have slowed the deployment of large-scale turbine projects, leading to a buildup of inventory and increased operational costs. Institutional investors are reacting to these systemic delays by reallocating capital away from industrial energy firms that exhibit high capital intensity and sensitivity to project timelines. The lack of a clear timeline for the resolution of these infrastructure constraints has introduced a risk premium that is currently weighing heavily on the company's valuation.
In the wake of the financial disclosures, several prominent Wall Street analysts have adjusted their price targets downward, citing a more conservative outlook on the company’s cash flow generation. This shift in sentiment has triggered a wave of institutional portfolio rebalancing, with significant outflows noted from thematic ETFs focused on renewable energy and industrial infrastructure. Market volatility is also being amplified by concerns over potential shifts in federal energy policy and subsidies, adding a layer of geopolitical uncertainty to the investment thesis. Consequently, the prevailing sentiment is one of caution as the market reassesses the company’s near-term growth trajectory amidst these multifaceted challenges.
Technical Analysis of Ge Vernova Inc (GEV)
Technically, Ge Vernova Inc (GEV) shows a MACD (12,26,9) value of -10.191, indicating a neutral signal. The RSI at 52.598 suggests neutral condition and the Williams %R at 54.749 suggests neutral condition. Please monitor closely.
Media Coverage of Ge Vernova Inc (GEV)
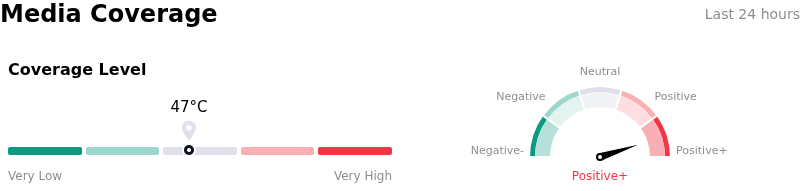
In terms of media coverage, Ge Vernova Inc (GEV) shows a coverage score of 47, indicating a moderate level of media attention. The overall market sentiment index is currently in extremely bullish zone.
Fundamental Analysis of Ge Vernova Inc (GEV)
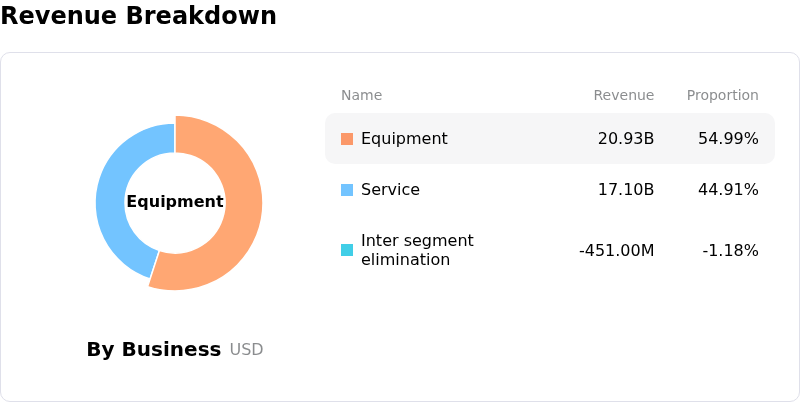
Ge Vernova Inc (GEV) is in the Utilities industry. Its latest annual revenue is $38.07B, ranking 2 in the industry. The net profit is $4.88B, ranking 4 in the industry. Company Profile
Over the past month, multiple analysts have rated the company as Buy, with an average price target of $1205.52, a high of $1424.00, and a low of $836.00.
More details about Ge Vernova Inc (GEV)
Company Specific Risks:
- Offshore Wind Technical Failures: Recent reports of a blade failure at the Dogger Bank offshore wind farm involving the Haliade-X turbine platform have raised significant concerns regarding structural integrity, potentially leading to costly fleet-wide inspections, warranty liabilities, and project delays.
- Persistent Wind Segment Losses: Despite strong performance in the Power and Electrification divisions, the Wind segment continues to report negative adjusted EBITDA, signaling that a return to profitability in this capital-intensive business remains uncertain and is acting as a primary drag on consolidated margins.
- Backlog Execution and Margin Compression: Institutional analysts have expressed concern over the company’s ability to convert its high-value backlog into realized revenue amidst persistent supply chain volatility and the burden of legacy contracts signed during lower-inflation environments.
- Concentration of Regulatory Risk: GE Vernova’s heavy reliance on subsidies related to the Inflation Reduction Act (IRA) creates vulnerability to shifting political climates and potential legislative changes that could diminish the financial viability of future renewable energy projects.
Recommended Articles


