


WTI (USOIL) Volatility Intensified on Jul 22: What to Watch
WTI (USOIL) is up 2.28% at Jul 22 03:05(ET), now at $86.39, with a 7-day up of 7.94%.
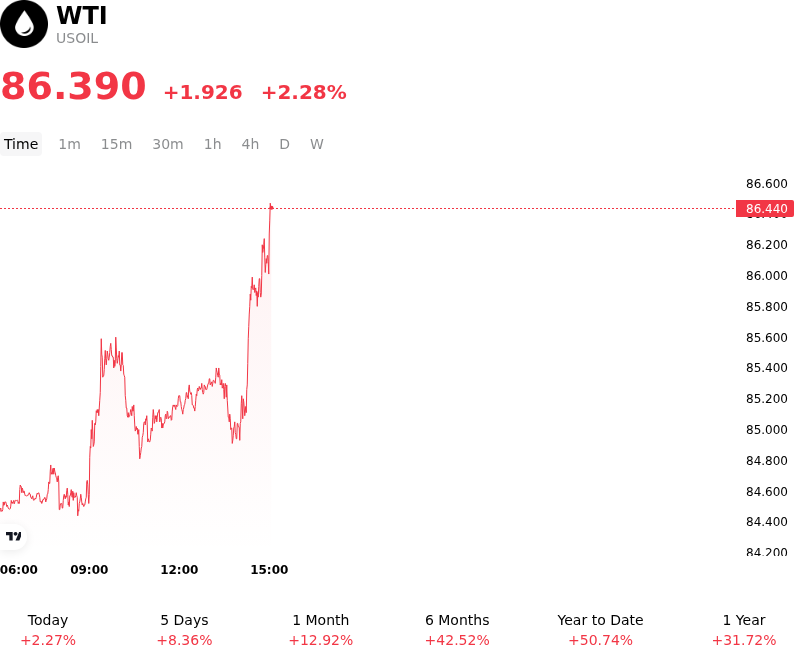
What is driving WTI (USOIL)’s stock price up today?
The advance in USOIL was primarily catalyzed by a sharp escalation in geopolitical risks within the Middle East, specifically the renewed disruption of maritime traffic through the Strait of Hormuz. Following the collapse of recent diplomatic efforts between the United States and Iran, military exchanges have severely restricted one of the world's most critical energy chokepoints. Institutional investors reacted to the immediate threat of a global supply deficit, as the blockade impacts the transit of nearly one-fifth of global petroleum consumption, rendering physical delivery mechanisms highly uncertain.
Supply-side constraints were further compounded by the realization that current OPEC+ production adjustments remain largely symbolic in the face of these logistical blockades. While the alliance recently signaled a phased unwinding of voluntary cuts, major Gulf producers depend on the Strait of Hormuz for the vast majority of their seaborne exports. Consequently, the market has pivoted from focusing on a potential year-end surplus to pricing in a severe short-term contraction in available global crude supplies, effectively negating the impact of official quota increases.
On the demand side, the price movement reflects seasonal strength typical of the July peak driving season. Despite underlying concerns regarding long-term economic headwinds in major manufacturing hubs, the immediate requirement to maintain refinery throughput in the United States has driven a repricing of near-term contracts. The market balance is currently being tested by a combination of high refinery utilization and the potential for domestic inventory drawdowns as imported barrels face significant delays.
Furthermore, institutional capital flows have shifted toward a more defensive posture, with significant long positioning in crude futures serving as a hedge against broader macroeconomic instability. The combination of heightened safe-haven demand and the risk of a structural shift in regional energy security has supported price levels. Investors remain focused on the duration of the current shipping disruptions, as a prolonged closure of transit routes would likely necessitate further adjustments to global inventory expectations and future pricing models.
Technical Analysis of WTI (USOIL)
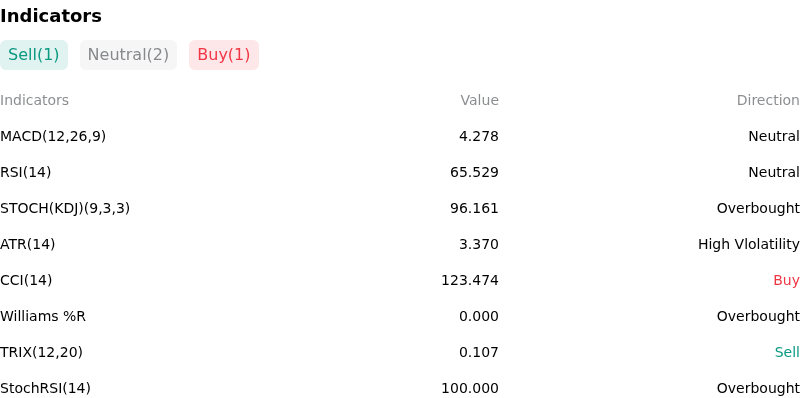
Technically, WTI (USOIL) shows a MACD (12,26,9) value of 4.278, indicating a neutral signal. The RSI at 65.529 suggests neutral condition and the Williams %R at 0.000 suggests overbought condition. Please monitor closely.
More details about WTI (USOIL)
Recent Events and Risks:
- Unexpected Inventory Accumulation: The latest EIA weekly status report revealed a substantial crude oil inventory build of 4.4 million barrels, sharply contradicting analyst expectations of a 700,000-barrel draw and signaling a sudden weakening in domestic refinery intake.
- Trade Policy and Demand Deterioration: Renewed threats of significant tariffs on major energy-trading partners have amplified fears of a global trade slowdown, which market participants expect will dampen industrial fuel consumption and trigger macro-driven liquidation of long positions.
- Erosion of Geopolitical Risk Premium: The continued stability of the Lebanon ceasefire has led to a sustained unwinding of the "war premium" in WTI prices, as the immediate threat to Middle Eastern supply infrastructure and transit routes has significantly diminished in the last 72 hours.
- Structural Oversupply Concerns: Despite reports that OPEC+ may further delay production hikes, institutional strategists remain focused on record-high non-OPEC production levels and lackluster Chinese manufacturing data, suggesting that a global supply surplus is likely to persist regardless of producer interventions.
Recommended Articles


