


BHP Group Ltd Stock (BHP) Moved Up by 3.63% on Jul 21: Key Drivers Unveiled
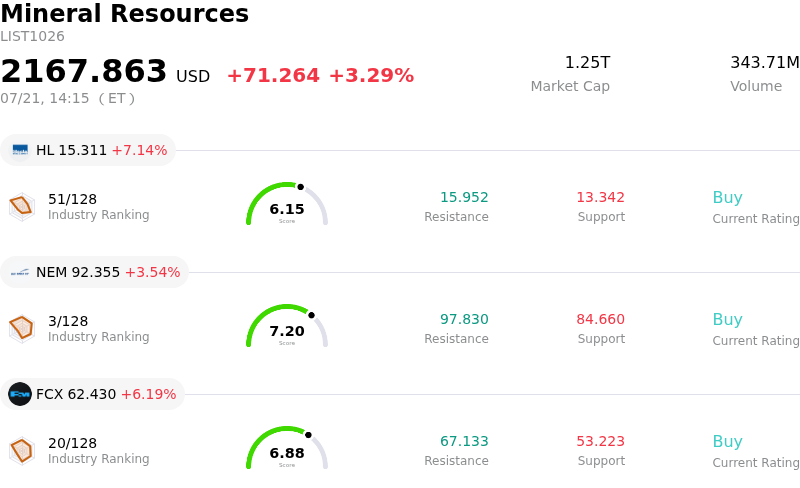
BHP Group Ltd (BHP) moved up by 3.63%. The Mineral Resources sector is up by 3.29%. The company outperformed the industry. Top 3 stocks by turnover in the sector: Hecla Mining Co (HL) up 7.14%; Newmont Corporation (NEM) up 3.54%; Freeport-McMoRan Inc (FCX) up 6.19%.
What is driving BHP Group Ltd (BHP)’s stock price up today?
BHP Group's upward trajectory today is primarily driven by the release of its full-year operational review, which showcased record-breaking iron ore production and a notable surplus in copper output compared to previous guidance. This operational excellence reinforces the company’s position as a premier low-cost producer, effectively insulating its margins from the persistent inflationary pressures that have hampered its smaller peers in the materials sector. Investors are particularly encouraged by the ramp-up at the Western Australia Iron Ore operations, which managed to hit the upper end of its annual target range despite seasonal weather challenges earlier in the year.
The broader commodity landscape provided a significant tailwind for the stock as global copper prices reached a multi-month high. Growing industrial demand, particularly from the renewable energy and artificial intelligence infrastructure sectors, has tightened the global supply-demand balance. BHP’s strategic pivot toward future-facing commodities is beginning to resonate more strongly with institutional portfolios, especially as the company accelerates the timeline for its Jansen potash project in Canada. This move is viewed as a critical hedge against the long-term cyclicality of the steel-making industry.
Market sentiment was further bolstered by renewed fiscal stimulus measures announced by China’s central planning agency. The proposed initiatives aimed at stabilizing the domestic property market and increasing infrastructure spending have directly improved the demand outlook for iron ore. As China remains the largest consumer of BHP’s exports, any signals of sustained economic recovery in the region provide a disproportionate boost to the company’s valuation and perceived revenue stability.
From a technical perspective, the stock's performance reflects a period of significant intraday volatility as it broke through several key resistance levels. This movement was supported by a series of analyst upgrades from major investment banks, which cited BHP’s robust cash flow generation and its disciplined approach to capital allocation. Institutional rebalancing has also played a role, with increased inflows into large-cap mining ETFs following the stabilization of the U.S. dollar, which makes dollar-denominated commodities more attractive to international buyers.
Despite the positive momentum, risks remain concerning geopolitical tensions affecting trade routes and potential fluctuations in global interest rates. However, the current consensus suggests that BHP’s diversified portfolio and operational consistency make it a preferred vehicle for investors seeking exposure to the global industrial recovery. The combination of strong production data and a favorable macroeconomic backdrop has created a powerful catalyst for the current buying interest.
Technical Analysis of BHP Group Ltd (BHP)
Technically, BHP Group Ltd (BHP) shows a MACD (12,26,9) value of -0.065, indicating a sell signal. The RSI at 44.222 suggests neutral condition and the Williams %R at 61.312 suggests sell condition. Please monitor closely.
Fundamental Analysis of BHP Group Ltd (BHP)
BHP Group Ltd (BHP) is in the Mineral Resources industry. Its latest annual revenue is $51.26B, ranking 3 in the industry. The net profit is $9.02B, ranking 2 in the industry. Company Profile
Over the past month, multiple analysts have rated the company as Hold, with an average price target of $72.58, a high of $91.00, and a low of $50.00.
More details about BHP Group Ltd (BHP)
Company Specific Risks:
- M&A Execution and Overpayment Risk: The ongoing pursuit of Anglo American creates significant uncertainty as the deadline for a binding offer approaches; market participants fear a significantly higher "sweetened" bid could lead to shareholder value destruction, asset divestment complexities, and credit rating pressure.
- Samarco Litigation Exposure: Recent court updates regarding the 2015 Fundão dam collapse indicate that BHP faces a substantially higher settlement figure than previously provisioned, with ongoing negotiations in Brazil suggesting potential liabilities could exceed $10 billion, severely impacting free cash flow.
- Iron Ore Demand Sensitivity: Persistent weakness in the Chinese property sector, BHP's primary end-market, continues to exert downward pressure on iron ore spot prices, threatening the company’s highest-margin revenue stream and triggering analyst downgrades on earnings-per-share estimates.
- Operational Margin Compression: Increasing labor costs in the Pilbara region and rising energy expenditures for mining operations are squeezing underlying EBITDA margins, as recent operational reports highlight a lack of immediate catalysts to offset high fixed-cost inflation.
Recommended Articles


