


Bitcoin (BTCUSD) Fluctuated Significantly on Jul 21: Key Variables Behind the Move
Bitcoin (BTCUSD) is up 1.04% at Jul 21 03:40(ET), now at $66018.08, with a 7-day up of 2.29%.
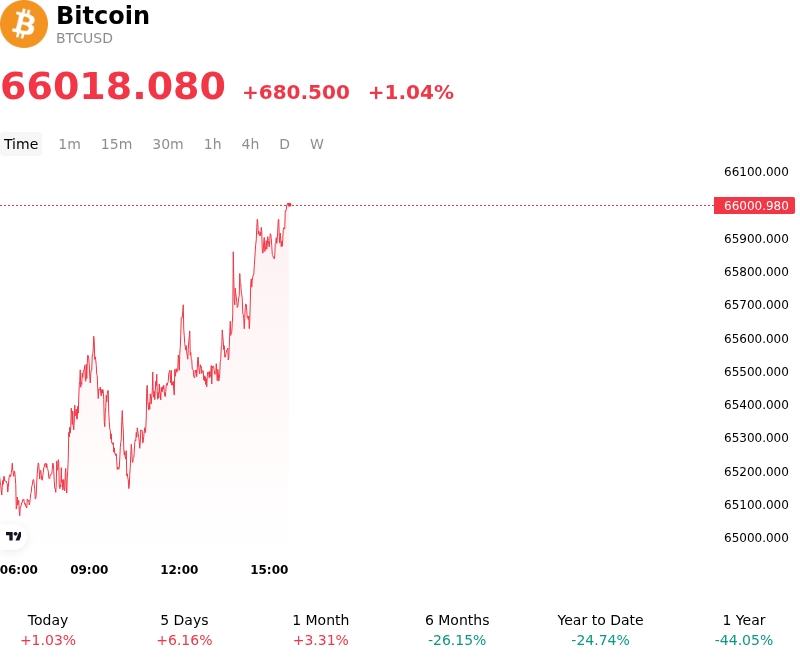
What is driving Bitcoin (BTCUSD)’s stock price up today?
Bitcoin’s recent appreciation is primarily driven by a favorable shift in global macro liquidity conditions and a renewed cooling of US Treasury yields. As market participants recalibrate expectations for Federal Reserve policy, the resulting softening of the US dollar has provided a significant tailwind for the broader digital asset complex. Bitcoin continues to serve as a high-beta sensitivity instrument to global M2 money supply growth, with the current move reflecting an increased appetite for inflation-hedging assets in a regime of persistent fiscal expansion.
Institutional demand remains a critical driver of price stability and upward momentum. Sustained net inflows into spot Bitcoin ETFs indicate that sovereign wealth funds and institutional asset managers are increasingly integrating digital assets into diversified portfolios. This consistent buy-side pressure from regulated vehicles has effectively absorbed a significant portion of exchange-side liquidity, creating a supply-demand imbalance that favors higher valuations. The transition from speculative retail activity to strategic institutional accumulation is fundamentally altering the asset’s volatility profile.
On-chain data confirms a tightening of the available supply, as the percentage of Bitcoin held by long-term investors continues to reach new cyclical highs. This illiquidity is being met with a surge in corporate treasury adoption and institutional custody services, further validating the store-of-value narrative. Additionally, the derivatives market has seen a notable increase in open interest, where a series of short-side liquidations provided the necessary momentum to breach near-term technical resistance levels. This short-covering activity, combined with positive spot-driven demand, suggests a robust underlying market structure.
While investors remain attentive to evolving regulatory frameworks in major jurisdictions, the prevailing sentiment is one of constructive growth. The current price action is viewed less as a speculative spike and more as a structural repricing driven by Bitcoin’s deepening integration into the global financial plumbing. As liquidity continues to flow into the ecosystem through institutional conduits, the market is demonstrating increased resilience against localized macroeconomic shocks, further cementing its role as a core component of the modern institutional investment landscape.
Technical Analysis of Bitcoin (BTCUSD)
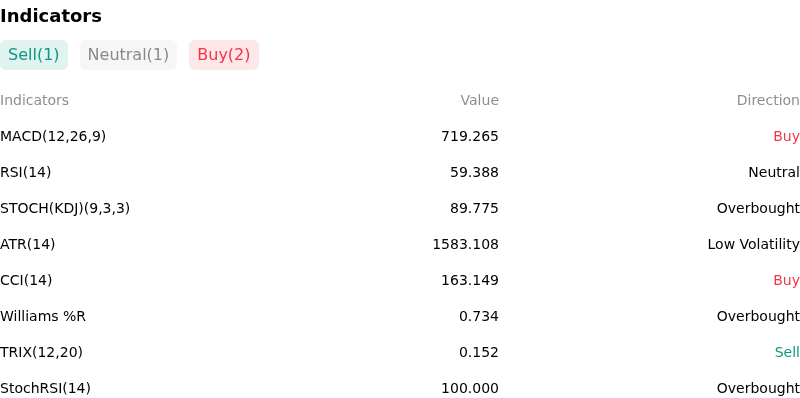
Technically, Bitcoin (BTCUSD) shows a MACD (12,26,9) value of 719.265, indicating a buy signal. The RSI at 59.388 suggests neutral condition and the Williams %R at 0.734 suggests overbought condition. Please monitor closely.
More details about Bitcoin (BTCUSD)
Recent Events and Risks:
- Hawkish Federal Reserve Sentiment: The release of the most recent FOMC minutes within the last 24 hours revealed that policymakers are increasingly concerned about persistent inflation, with some officials indicating a willingness to hike interest rates again if necessary; this shift has bolstered the U.S. Dollar Index (DXY), creating significant downward pressure on BTCUSD as a non-yielding risk asset.
- Heightened Long Liquidation Risk: A buildup of leveraged long positions in the perpetual futures market over the past 48 hours has increased the risk of a "long squeeze"; current market structure suggests that even a minor intraday price dip could trigger a cascade of automated liquidations, leading to a rapid and disproportionate price correction.
- Persistent Supply Overhang from Mt. Gox: Continued market sensitivity to the potential distribution of over 140,000 BTC to Mt. Gox creditors remains a major downside catalyst, as any movement in associated cold wallets or updates regarding the October repayment deadline prompts preemptive selling and de-risking by institutional desks.
- Regulatory Uncertainty and ETF Profit-Taking: Despite the passing of the FIT21 crypto bill in the House, ongoing tension between the SEC and major exchanges regarding token classification continues to weigh on sentiment, leading to a deceleration in spot ETF net inflows as investors opt for profit-taking amid the current regulatory "wait-and-see" environment.
Recommended Articles


