


Qualcomm Inc Stock (QCOM) Moved Down by 3.04% on Jul 14: Drivers Behind the Movement
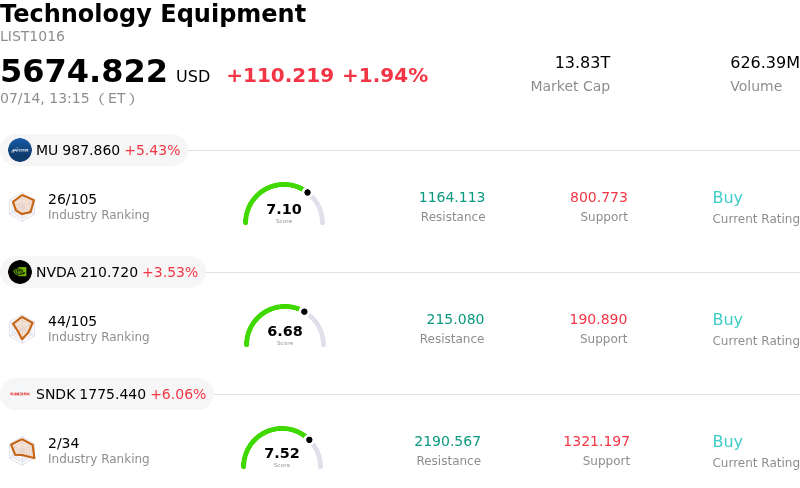
Qualcomm Inc (QCOM) moved down by 3.04%. The Technology Equipment sector is up by 1.94%. The company underperformed the industry. Top 3 stocks by turnover in the sector: Micron Technology Inc (MU) up 5.55%; NVIDIA Corp (NVDA) up 3.53%; SanDisk Corporation (SNDK) up 6.06%.
What is driving Qualcomm Inc (QCOM)’s stock price down today?
The downward pressure on Qualcomm today reflects a combination of sector-specific headwinds and heightened concerns regarding the company's long-term supply relationship with its largest customers. As the broader semiconductor industry grapples with a shift in investor sentiment, Qualcomm has found itself particularly vulnerable to reports suggesting an acceleration in the transition toward in-house silicon by major smartphone manufacturers. The prospect of losing high-margin modem volume sooner than previously anticipated is weighing heavily on the stock's valuation multiples.
A primary catalyst for the current volatility is the renewed uncertainty surrounding the premium handset market. Recent supply chain data indicates a cooling of demand for high-end mobile devices, particularly in key Asian markets where local competition is intensifying. As domestic competitors gain traction with integrated solutions, Qualcomm faces a challenging environment to maintain its historical pricing power and market share in the Snapdragon ecosystem. This saturation in the core mobile business is forcing investors to re-evaluate the company's growth trajectory for the remainder of the fiscal year.
Furthermore, the market appears to be reacting to the slower-than-expected ramp-up in Qualcomm's diversification efforts. While the company has made significant technological strides in the automotive and artificial intelligence PC sectors, these segments still represent a minority of total revenue. In a market environment that is increasingly demanding immediate returns from AI-related investments, the long lead times associated with automotive design wins are testing investor patience. The lack of a near-term offset to the volatility in mobile licensing and chip sales is contributing to the current retreat.
Macroeconomic factors are also playing a significant role in today's price movement. Continued concerns over the Federal Reserve's interest rate path are impacting capital-intensive technology stocks. With the cost of capital remaining elevated, institutional investors are rotating away from companies with high exposure to cyclical consumer spending. Qualcomm's sensitivity to global discretionary income makes it a natural target for de-risking during periods of economic uncertainty.
From a technical standpoint, the breach of key moving averages has triggered systematic selling. As the stock failed to maintain support levels established earlier in the quarter, quantitative funds and retail traders alike have accelerated their exits. This institutional rebalancing, combined with a lack of positive catalysts ahead of the next earnings cycle, has left the shares struggling to find a floor in the current trading session. The combination of structural competitive threats and a challenging macro backdrop remains the dominant narrative for the stock.
Technical Analysis of Qualcomm Inc (QCOM)
Technically, Qualcomm Inc (QCOM) shows a MACD (12,26,9) value of -2.219, indicating a sell signal. The RSI at 43.068 suggests neutral condition and the Williams %R at 74.931 suggests sell condition. Please monitor closely.
Media Coverage of Qualcomm Inc (QCOM)
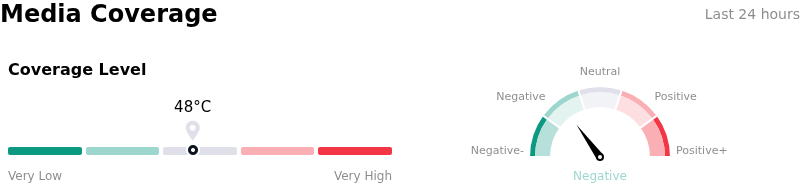
In terms of media coverage, Qualcomm Inc (QCOM) shows a coverage score of 48, indicating a moderate level of media attention. The overall market sentiment index is currently in bearish zone.
Fundamental Analysis of Qualcomm Inc (QCOM)
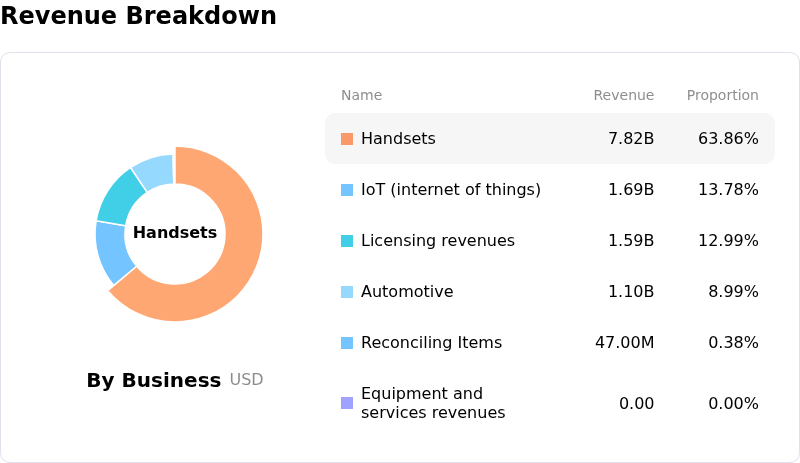
Qualcomm Inc (QCOM) is in the Technology Equipment industry. Its latest annual revenue is $44.28B, ranking 5 in the industry. The net profit is $5.54B, ranking 7 in the industry. Company Profile
Over the past month, multiple analysts have rated the company as Hold, with an average price target of $216.84, a high of $314.00, and a low of $100.00.
More details about Qualcomm Inc (QCOM)
Company Specific Risks:
- ARM Litigation Uncertainty: Recent developments in the legal battle with ARM Holdings over Nuvia-derived IP licenses threaten the structural viability of the Snapdragon X Elite product line, risking significant royalty escalations or product injunctions.
- Apple Modem Transition: Supply chain reports indicate Apple is making substantial progress on its proprietary modem hardware, increasing the risk of a sharp revenue drop-off as the current multi-year supply agreement moves toward its 2026 expiration.
- China Market Share Erosion: The resurgence of Huawei and its Kirin-based devices, combined with intensified competition from MediaTek in the mid-to-high-end segments, poses a direct threat to Qualcomm’s QCT segment earnings and premium handset chip shipments.
- AI PC Execution Risk: As the company expands into the Windows-on-ARM market, immediate competitive pressure from Intel’s Lunar Lake and AMD’s Ryzen AI 300 series creates significant hurdles for market share acquisition and software ecosystem optimization.
Recommended Articles


