


WTI (USOIL) Volatility Intensified on Jul 14: What to Watch
WTI (USOIL) is up 2.08% at Jul 14 00:05(ET), now at $79.548, with a 7-day up of 10.29%.
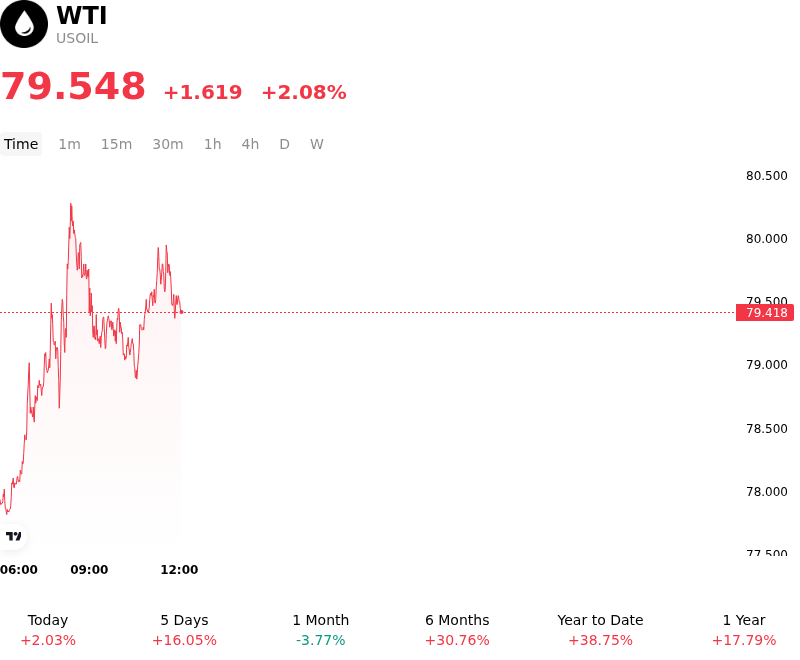
What is driving WTI (USOIL)’s stock price up today?
The advance in USOIL was primarily driven by a sharp escalation in geopolitical tensions within the Middle East, specifically centering on renewed disruptions to maritime traffic in the Strait of Hormuz. Market participants aggressively priced in a heightened risk premium following the U.S. decision to reimpose a naval blockade on Iranian shipping, a move that significantly threatens the stability of one of the world's most critical energy transit chokepoints. This development was further exacerbated by reports of direct military engagement, including missile attacks on commercial tankers in Omani territorial waters, which underscored the immediate vulnerability of global supply chains.
The intensification of the U.S.-Iran conflict has shifted the market's focus away from recent macroeconomic headwinds and toward the possibility of a material supply deficit. While OPEC recently lowered its 2026 global oil demand growth forecast for the third consecutive month, citing economic instability and softer consumption in major importing nations, the immediate threat to existing production and transportation infrastructure has dominated price action. Investors are prioritizing the risk of sustained logistics disruptions over the longer-term demand softening highlighted by both OPEC and the International Energy Agency.
Furthermore, institutional positioning was influenced by the contrast between OPEC+ production policy and the current security environment. Although the cartel recently agreed to a marginal increase in production targets for the coming month, the physical ability to deliver these barrels is now in question due to the blockade and the ongoing threat to Gulf exports. The reinstatement of U.S. strikes against regional targets has also raised the probability of a broader conflict, leading to capital flows into energy futures as a hedge against potential energy insecurity.
From a macroeconomic perspective, the rally also reflects a repricing of inflation expectations. With the International Monetary Fund and Federal Reserve officials noting that energy shocks are stalling the global disinflation trend, the prospect of sustained higher crude prices is being factored into broader interest-rate expectations. Despite the resilience shown by major economies, the combination of restricted supply routes and the potential for prolonged military activity in the Persian Gulf has created a structural floor for prices in the near term, as the market balances a fragile demand outlook against a volatile and tightening supply environment.
Technical Analysis of WTI (USOIL)
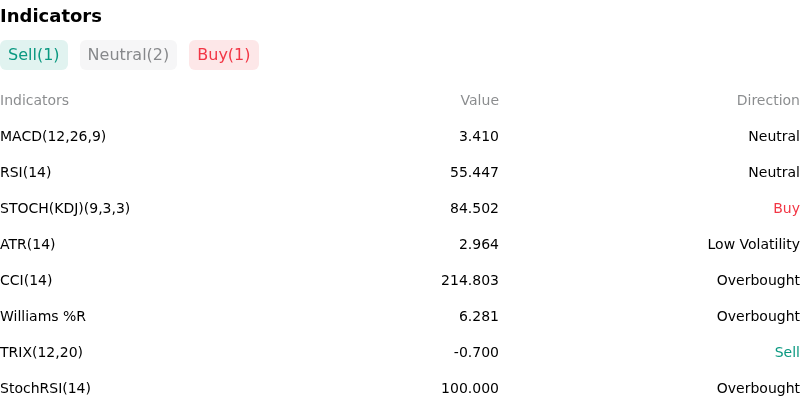
Technically, WTI (USOIL) shows a MACD (12,26,9) value of 3.410, indicating a neutral signal. The RSI at 55.447 suggests neutral condition and the Williams %R at 6.281 suggests overbought condition. Please monitor closely.
More details about WTI (USOIL)
Recent Events and Risks:
- Unexpected Inventory Build: The American Petroleum Institute (API) reported a significant build in crude oil inventories for the latest week, surprising analysts who expected a draw and suggesting a near-term supply glut in the U.S. domestic market.
- Softening China Industrial Demand: Fresh economic data released within the last 48 hours shows a contraction in Chinese manufacturing activity and lower crude import volumes, intensifying fears that the world’s largest oil importer is facing a structural demand slowdown.
- Geopolitical Risk De-escalation: Renewed diplomatic efforts and reports of a potential framework for a regional ceasefire have led to a rapid liquidation of long positions as the geopolitical risk premium evaporates from the current price structure.
- Macro-Driven Liquidation: A stronger-than-anticipated U.S. Dollar Index (DXY) following hawkish central bank commentary has placed immediate downward pressure on dollar-denominated commodities, triggering stop-loss orders in the USOIL spot and futures markets.
Recommended Articles


