


Ethereum (ETHUSD) Fluctuated Significantly on Jul 12: Key Variables Behind the Move
Ethereum (ETHUSD) is down 1.02% at Jul 12 00:35(ET), now at $1804.83, with a 7-day up of 1.70%.
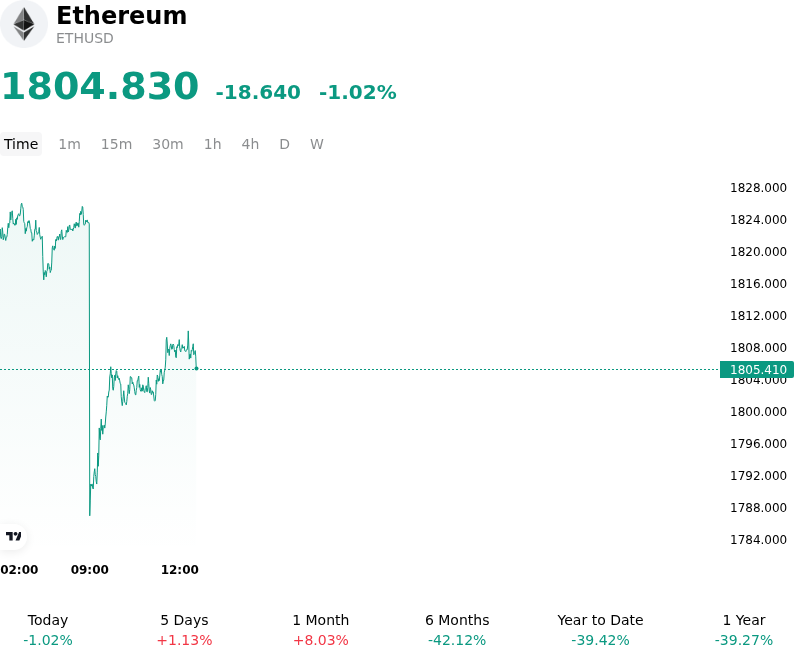
What is driving Ethereum (ETHUSD)’s stock price down today?
The retreat in Ethereum prices reflects a broader de-risking phase among institutional investors, primarily driven by a resurgence in US Treasury yields and a strengthening Dollar Index. As global macro liquidity conditions tighten slightly in response to recent hawkish signals from Federal Reserve officials, capital is rotating away from high-beta digital assets toward traditional defensive instruments. This shift has been evidenced by a slowdown in net inflows to spot Ethereum exchange-traded products, suggesting that the initial momentum from institutional adoption is facing a period of consolidation.
On-chain metrics indicate a temporary reduction in network fee burning, largely due to the continued migration of transactional volume toward Layer-2 scaling solutions. While this transition is beneficial for long-term scalability, the immediate impact on ETH's supply-side dynamics has dampened the deflationary narrative that often supports price appreciation during periods of high activity. Furthermore, a slight compression in staking yields has prompted some large-scale validators to rebalance their portfolios, adding to the localized sell-side pressure.
In the derivatives market, the liquidation of leveraged long positions near key technical resistance levels has exacerbated the downward move. High open interest in perpetual futures had created a fragile market structure, leaving the asset vulnerable to a flush-out once the spot price failed to clear overhead supply. This positioning-driven volatility highlights a shift in short-term sentiment from aggressive accumulation to cautious capital preservation.
Investors are also closely monitoring regulatory clarity regarding decentralized finance protocols and liquid staking derivatives. Uncertainty surrounding potential oversight adjustments has introduced a risk premium that is currently weighing on the asset's valuation. While the long-term structural case for Ethereum as the foundational layer for global finance remains intact, the current price action suggests a necessary reset of expectations as the market digests recent macro headwinds and adjusting liquidity flows.
Technical Analysis of Ethereum (ETHUSD)
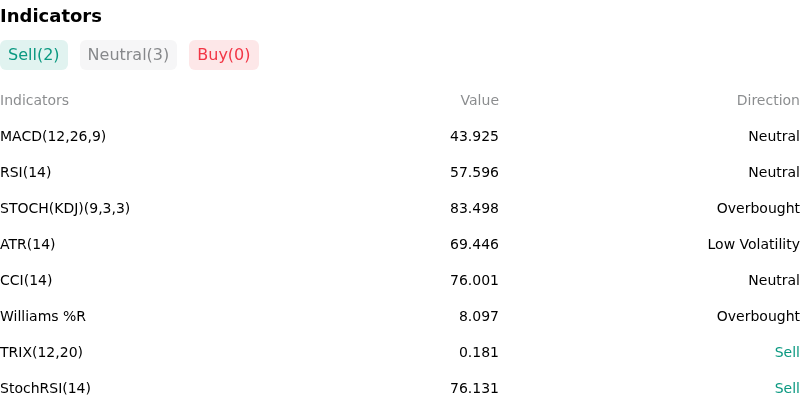
Technically, Ethereum (ETHUSD) shows a MACD (12,26,9) value of 43.925, indicating a neutral signal. The RSI at 57.596 suggests neutral condition and the Williams %R at 8.097 suggests overbought condition. Please monitor closely.
More details about Ethereum (ETHUSD)
Recent Events and Risks:
- Spot ETF S-1 Approval Uncertainty: While initial 19b-4 filings were approved, the lack of a confirmed timeline for S-1 registration statements to become effective has triggered a "sell-the-news" reaction, leaving the market vulnerable to downside volatility if institutional inflows are delayed beyond investor expectations.
- Increased Exchange Inflows and Whale Activity: On-chain monitoring reveals significant ETH transfers to centralized exchanges from long-dormant wallets and large-scale holders, suggesting a buildup of sell-side pressure that could lead to a rapid price correction if local support levels are breached.
- Regulatory Scrutiny of Staking Services: Persistent legal uncertainty regarding the SEC's stance on Ethereum's staking mechanism—exemplified by the exclusion of staking features from approved ETF products—continues to pose a risk to protocol-level participation and institutional sentiment toward the asset's core yield-bearing properties.
- Macroeconomic Headwinds and Risk-Off Sentiment: Hawkish commentary from central bank officials and higher-than-expected yields have strengthened the US Dollar, creating a negative correlation environment that pressures ETH prices as traders reduce exposure to high-beta digital assets during periods of thinning liquidity.
Recommended Articles


