


BNB (BNBUSD) Is down 1.00% on Jul 12: Here Is Why
BNB (BNBUSD) is down 1.00% at Jul 12 00:15(ET), now at $573.2, with a 7-day down of 2.20%.
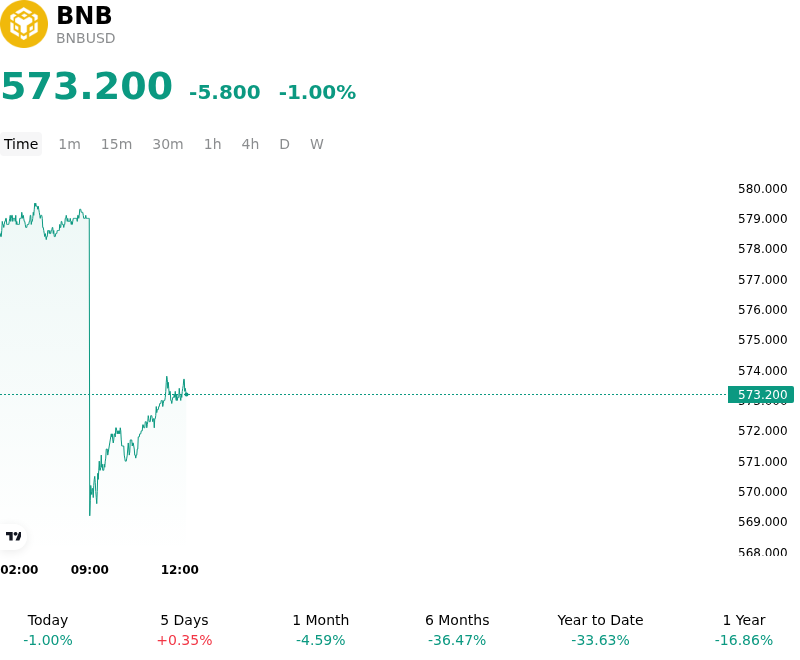
What is driving BNB (BNBUSD)’s stock price down today?
The decline in BNBUSD reflects a broader shift in risk appetite across the digital asset landscape, largely influenced by tightening global liquidity conditions and a localized cooling of ecosystem-specific demand. As US Treasury yields exhibit upward pressure, institutional investors have prioritized de-risking, moving away from high-beta utility tokens toward more defensive allocations. This macro-driven rotation has dampened the capital flows that typically support the valuation of exchange-linked assets during periods of heightened volatility.
From a structural perspective, the asset remains highly sensitive to the perceived health and transaction volume of its underlying ecosystem. A recent deceleration in on-chain activity and a lack of significant new protocol launches on the BNB Chain have led to a reduction in the organic demand for the token. Institutional desks, which often view BNB as a proxy for the health of the centralized exchange sector, have adjusted their positioning in response to evolving regulatory discourse in key global markets, opting for a wait-and-see approach that has limited buy-side support.
Market liquidity and derivatives positioning also played a critical role in the intraday price action. The breach of key psychological levels triggered a series of long liquidations in the perpetual futures market, creating a feedback loop of selling pressure that exacerbated the downward move. This flush of leverage suggests that speculative positioning had become overextended, making the asset vulnerable to even minor shifts in sentiment or macro headwinds.
Investors are currently focusing on the sustainability of decentralized finance activity and the potential for new institutional adoption milestones within the broader Binance ecosystem. Until there is a clearer catalyst in the form of increased network utility or a more dovish shift in Federal Reserve policy, the asset is likely to remain sensitive to broader market trends and shifts in the US dollar index. Risk appetite remains cautious as participants monitor the impact of higher-for-longer interest rates on the total value locked within competing Layer-1 networks.
Technical Analysis of BNB (BNBUSD)
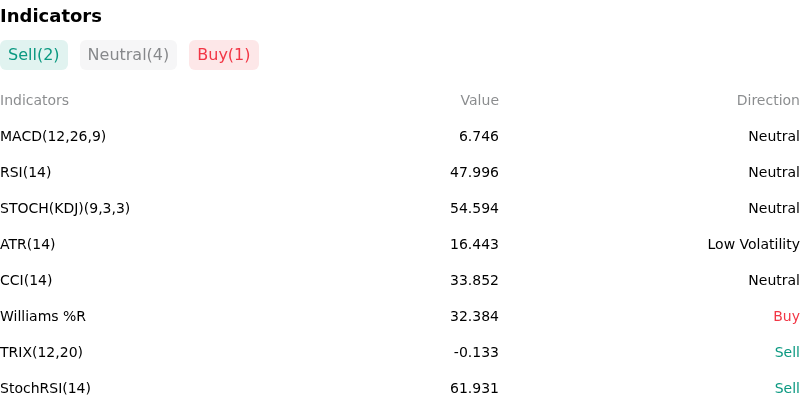
Technically, BNB (BNBUSD) shows a MACD (12,26,9) value of 6.746, indicating a neutral signal. The RSI at 47.996 suggests neutral condition and the Williams %R at 32.384 suggests buy condition. Please monitor closely.
More details about BNB (BNBUSD)
Recent Events and Risks:
- Persistent Regulatory Litigation: The ongoing legal battle between the SEC and Binance regarding the classification of BNB as an unregistered security continues to act as a significant headwind, with recent court filings and discovery disputes maintaining a high level of long-term uncertainty and deterring institutional entry.
- Jurisdictional Compliance Headwinds: Recent reports of intensifying legal pressure and executive detention in Nigeria, alongside evolving regulatory requirements in the EU under MiCA, create operational risks for Binance that could lead to localized liquidity constraints or a reduction in regional user activity for the BNB ecosystem.
- Concentrated On-Chain Whale Activity: Large-scale transfers of BNB from dormant or private wallets to exchange deposit addresses over the last 48 hours indicate potential profit-taking, increasing the risk of immediate sell-side pressure that could overwhelm local bid depth.
- Leverage-Induced Liquidation Risk: A recent buildup in open interest for BNB/USDT perpetual contracts, combined with fluctuating funding rates, has created a high-leverage environment where a minor correction in the broader market could trigger a cascade of long liquidations, disproportionately impacting BNB's price stability.
Recommended Articles


