


Bitcoin (BTCUSD) Is up 1.16% on Jul 9: What Are the Risk Factors?
Bitcoin (BTCUSD) is up 1.16% at Jul 9 02:30(ET), now at $62791.99, with a 7-day up of 2.01%.
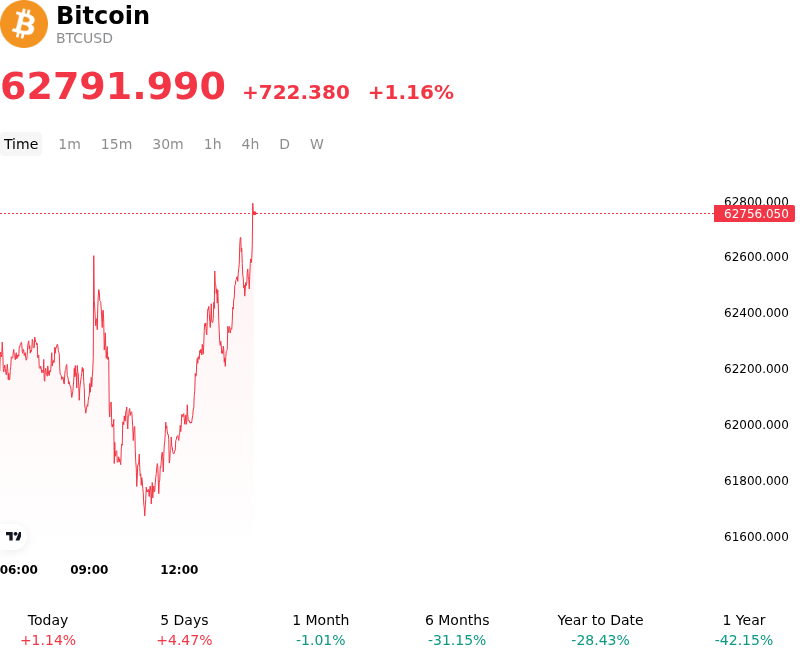
What is driving Bitcoin (BTCUSD)’s stock price up today?
Bitcoin experienced positive intraday momentum as capital flowed back into the leading digital asset, driven by a combination of favorable macroeconomic developments, recovering spot ETF activity, and historically strong seasonal patterns. Investor sentiment and risk appetite were bolstered by softer-than-expected economic data, helping the cryptocurrency stabilize and build on its recent recovery.
The primary catalyst supporting the upward movement was a shift in macroeconomic and monetary policy expectations. Following weaker U.S. employment data, which showed a significant slowdown in job creation, market participants adjusted their outlook for the Federal Reserve's rate path. The reduced probability of prolonged monetary tightening lowered Treasury yield pressures and eased the U.S. dollar's strength, creating a more favorable global liquidity environment for non-yielding speculative assets like Bitcoin.
In tandem with easing macroeconomic headwinds, institutional demand via U.S. spot Bitcoin ETFs showed crucial signs of stabilization. After enduring a prolonged period of net capital flight, the spot ETF market recorded a major trend reversal with substantial net inflows. This return of institutional buying pressure acted as a strong absorption mechanism for market supply, reinforcing investor confidence and signaling that institutional players are capitalizing on recent price dips.
On-chain metrics and historical market behavior further supported the bullish intraday tone. Analysts highlighted strong historical seasonality, noting that July has consistently been one of the asset's top-performing months, even during broader corrective cycles. With on-chain data pointing to persistent accumulation by long-term holders and a reduction in realized profit-taking, the market structure began exhibiting bottoming behavior. This technical resilience prompted short-term derivatives traders to cover short positions, fueling additional upward pressure as spot-driven demand led the market higher.
Technical Analysis of Bitcoin (BTCUSD)
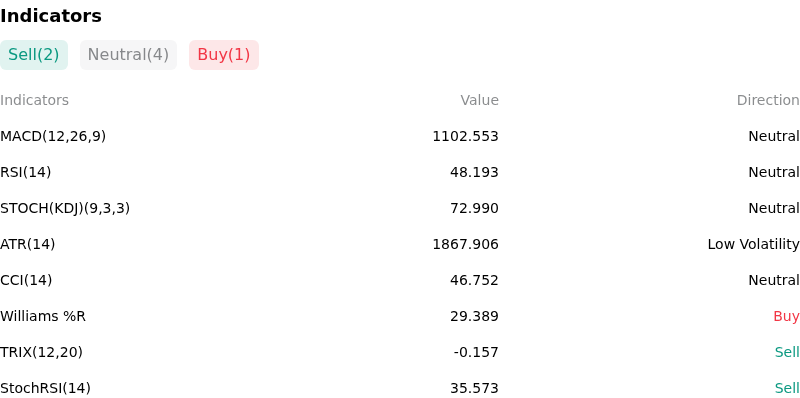
Technically, Bitcoin (BTCUSD) shows a MACD (12,26,9) value of 1102.553, indicating a neutral signal. The RSI at 48.193 suggests neutral condition and the Williams %R at 29.389 suggests buy condition. Please monitor closely.
More details about Bitcoin (BTCUSD)
Recent Events and Risks:
- Severe Institutional Outflows from Spot ETFs: The market is highly vulnerable to the structural reversal of institutional demand. Following a historic $4.5 billion in net outflows from U.S. spot Bitcoin ETFs—with BlackRock's IBIT accounting for approximately 75% of those redemptions—any continuation of this capital flight threatens to transform ETFs from a reliable demand driver into a persistent source of downside pressure.
- Macro Headwinds and Geopolitical Escalation: Rising geopolitical tensions and the threat of war in the Middle East have driven up oil and energy prices, fueling persistent inflationary pressures. This macro backdrop has raised concerns that the Federal Reserve may maintain tight monetary policy or delay rate cuts, driving capital away from speculative risk assets like Bitcoin and into cash, bonds, or high-performing AI equities.
- On-Chain Distribution and Whale Selling Pressure: Short-term supply overhangs persist as large holders actively distribute coins. Recently, the Bitcoin exchange whale ratio spiked to a local high of 0.69, indicating aggressive deposits to centralized platforms. Concurrently, tactical treasury management by nation-states, such as Bhutan-linked wallets transferring hundreds of BTC to Binance, continues to inject localized spot selling pressure into thin order books.
- Regulatory Overhang and Impending Exchange Restructuring: On July 8, 2026, the U.S. SEC formalized its 2026 regulatory agenda targeting digital asset offerings, market structures, and broker-dealer custody requirements. Analysts warn that while the proposed guidelines aim to provide long-term clarity, the impending rollout of "Regulation Crypto" could lead to strict compliance burdens, asset segregation mandates, and the potential delisting of various digital assets from U.S. platforms.
Recommended Articles


