


BHP Group Ltd Stock (BHP) Moved Down by 4.15% on Jul 7: Key Drivers Unveiled
BHP Group Ltd (BHP) moved down by 4.15%. The Mineral Resources sector is down by 2.82%. The company underperformed the industry. Top 3 stocks by turnover in the sector: Freeport-McMoRan Inc (FCX) down 2.84%; Hecla Mining Co (HL) down 6.50%; Newmont Corporation (NEM) down 3.21%.
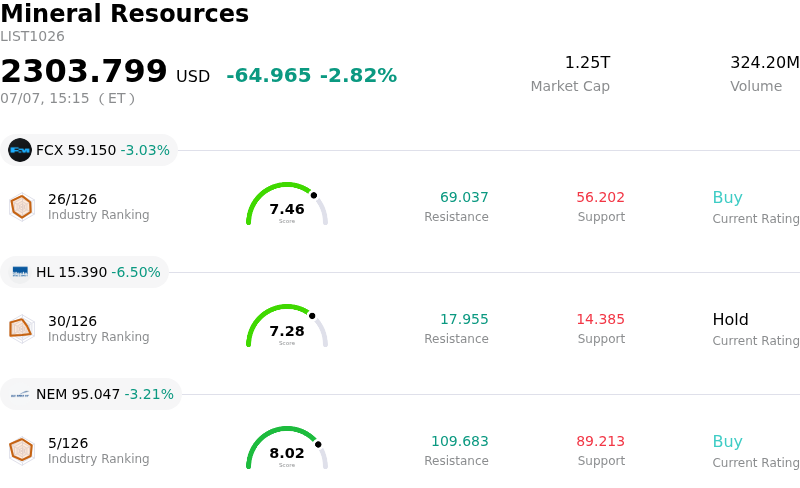
What is driving BHP Group Ltd (BHP)’s stock price down today?
BHP Group has experienced notable downward pressure and intraday volatility, driven by a combination of falling commodity prices, significant project cost overruns, and broader macroeconomic concerns weighing on the materials sector.
A primary driver of the downward movement is the weakness in the iron ore market. Iron ore, which remains the cornerstone of BHP's revenue and profitability, has seen a sustained decline, hitting multi-month lows. This downward trend is heavily tied to soft industrial demand from China, where steel consumption has remained subdued. Additionally, investor anxiety is mounting over a looming influx of new global supply from major upcoming mining projects, further depressing the commodity's outlook. Because BHP’s financial health is tightly linked to iron ore, the prolonged pricing weakness has directly damaged investor sentiment.
Beyond sector-wide commodity declines, BHP is grappling with severe company-specific operational setbacks. The mining giant recently disclosed a massive cost blowout at its Jansen Stage 2 potash project in Canada. A detailed review forced the company to raise the total investment estimate for this phase by billions of dollars and delay the expected timeline for first production. Crucially, this capital expenditure surge has triggered an impending multi-billion-dollar asset impairment charge that BHP will have to recognize in its upcoming financial results, raising serious questions among investors about capital efficiency and near-term cash flow constraints.
Though BHP recently secured initial environmental approvals to advance its multi-billion-dollar Escondida copper expansion in Chile, the massive scale of capital required for this and other projects highlights the intensive spending cycle the company is entering. While copper remains a critical long-term growth driver, high capital expenditure requirements, coupled with declining ore grades at existing operations, mean the company must invest aggressively just to sustain current output levels.
Adding to these headwinds is a transition in executive leadership, with Brandon Craig officially taking over as chief executive officer this month. This leadership change coincides with unresolved labor disputes, specifically potential industrial action at the critical Port Hedland iron ore operations in Western Australia, which could threaten output if reignited. Faced with falling benchmark prices for its core commodities, rising project costs, and operational uncertainties, investors have adopted a highly cautious stance, leading to the stock’s sharp retreat.
Technical Analysis of BHP Group Ltd (BHP)
Technically, BHP Group Ltd (BHP) shows a MACD (12,26,9) value of -0.909, indicating a sell signal. The RSI at 47.574 suggests neutral condition and the Williams %R at 72.270 suggests sell condition. Please monitor closely.
Fundamental Analysis of BHP Group Ltd (BHP)
BHP Group Ltd (BHP) is in the Mineral Resources industry. Its latest annual revenue is $51.26B, ranking 3 in the industry. The net profit is $9.02B, ranking 2 in the industry. Company Profile
Over the past month, multiple analysts have rated the company as Hold, with an average price target of $72.58, a high of $91.00, and a low of $50.00.
More details about BHP Group Ltd (BHP)
Company Specific Risks:
- Commodity Price Depressions: Iron ore prices have continued their downward trajectory, sliding below $98 a tonne due to weakening steel demand in China. Combined with a 6.5% drop in copper prices, this contraction directly squeezes BHP's near-term operational margins and profitability.
- Potash Project Cost Blowouts and Write-Downs: The flagship Jansen potash project in Canada has suffered a massive $2 billion capital expenditure estimate increase, ballooning total investment costs for Stage 2 to $6.9 billion. This escalation is accompanied by a massive $2.3 billion asset impairment charge, forcing analysts to slash the expected internal rate of return for the project's development stages by nearly half.
- Supply Pressures and Looming Market Crowding: Global iron ore supply is rising following a massive production ramp-up at the giant Chinese-backed Simandou mine in Guinea, threatening to trigger severe oversupply in BHP's core market. Concurrently, the Jansen project is scheduled to enter production in a crowded global potash market, facing an estimated 8% increase in global capacity by 2030 that could permanently depress potash prices.
- Labor Disputes and Regional Strike Risks: Ongoing labor tensions threaten operational continuity. Specifically, analysts warn that unresolved industrial disputes at the Port Hedland export facility and the threat of re-igniting strike actions across the crucial Pilbara iron ore operations in Western Australia present immediate risks to output volumes.
Recommended Articles


