


Gold-Silver Ratio: How Investors Use It to Read Precious-Metals Markets
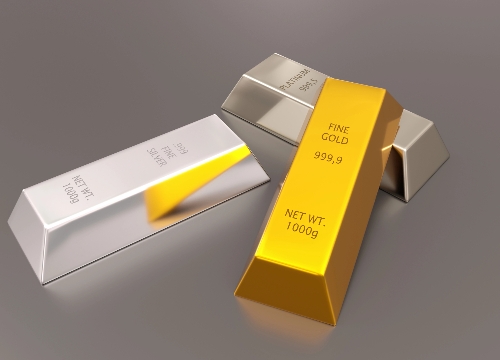
Gold or silver—which offers better value, and how can you tell? The gold silver ratio offers a starting point, showing how the two metals are priced relative to each other. But an unusually high or low reading is a clue, not an automatic trading signal.
This guide explains how to interpret the ratio, avoid common traps, and use it to inform allocation and trading decisions.
What Is the Gold-Silver Ratio?
The gold silver ratio measures how many troy ounces of silver have the same market value as one troy ounce of gold. A reading of 80:1 means one ounce of gold is worth approximately 80 ounces of silver before transaction costs.
How to Calculate the Gold-Silver Ratio?
The calculation is straightforward:
Gold silver ratio = Gold price per ounce ÷ Silver price per ounce
For example, if gold trades at $3,000 and silver at $40, the ratio is:
$3,000 ÷ $40 = 75:1
The ratio helps answer a relative-performance question:
A rising ratio: Gold is outperforming silver.
A falling ratio: Silver is outperforming gold.
Outperformance does not necessarily mean rising prices. If gold falls 5% while silver falls 15%, gold outperforms and the ratio rises.
The Historical Evolution of the Gold-Silver Ratio
The gold-silver ratio dates back to ancient trade, with no single launch date. The US mint set it at 15:1 in 1792 and about 16:1 in 1834 before market pricing replaced fixed monetary rules, while the chart below shows its major movements since 2003.
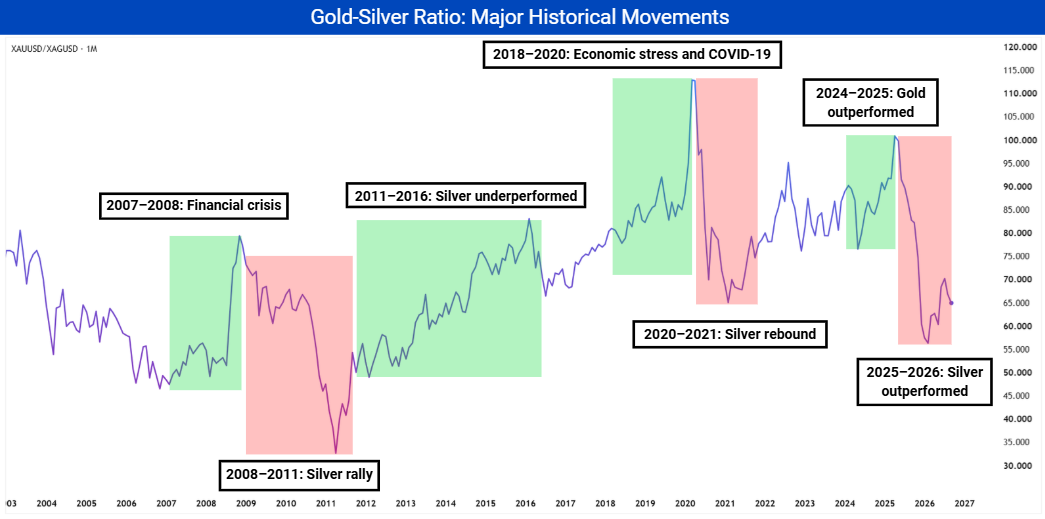
2007–2008: Financial crisis. The ratio rose as financial conditions deteriorated and gold outperformed silver. The upward movement meant one ounce of gold could buy more silver ounces, reflecting gold’s stronger relative performance during the crisis.
2008–2011: Silver rally. After its crisis-era rise, the ratio fell sharply as silver outperformed gold. It reached approximately 32 in 2011, meaning around 32 ounces of silver had the same market value as one ounce of gold.
2011–2016: Silver underperformed. The ratio climbed from its 2011 low as silver lost ground relative to gold. Despite fluctuations, the highlighted period shows a sustained increase in gold’s purchasing power measured in silver ounces.
2018–2020: Economic stress and COVID-19. The ratio rose amid economic uncertainty, then surged above 110 during the COVID-19 shock. Gold outperformed silver substantially, pushing the ratio to the highest level shown on the chart.
2020–2021: Silver rebound. Following the 2020 peak, the ratio declined sharply as silver recovered and outperformed gold. This reversed part of the earlier expansion, with fewer silver ounces needed to match the value of one ounce of gold.
2024–2025: Gold outperformed. The ratio moved higher as gold gained strength relative to silver, reaching approximately 100. The highlighted rise shows another period when gold’s market value increased compared with silver’s.
2025–2026: Silver outperformed. The ratio dropped sharply as silver gained ground relative to gold. It fell below 60 before rebounding, showing that a period of silver outperformance can include temporary moves back in gold’s favor.
These cycles illustrate alternating periods of gold and silver outperformance. A rising ratio means gold is outperforming silver, while a falling ratio means silver is outperforming gold even when both metals move in the same price direction.
What Moves the Gold-Silver Ratio?
The ratio changes whenever gold and silver produce different percentage returns. Four forces explain most large movements.
✅ Economic fear and liquidity: Investors often favor gold during stress. Silver may fall faster because industrial activity drives part of its demand.
✅ Manufacturing conditions: Demand from electronics, solar equipment, vehicles and electrical infrastructure can support silver and lower the ratio.
✅ Central-bank activity: Central banks buy gold but generally not silver. Heavy official purchases can lift gold independently.
✅ Interest rates and the dollar: Higher real yields can pressure both metals. The ratio depends on which one faces the larger demand change.
Mine output alone does not determine the ratio. Bullion stocks, recycling, investor holdings and central-bank purchases can affect tradable supply more quickly.
Interpreting the Signals: Normal vs High vs Low Ratio Readings
There is no permanent normal gold-silver ratio. A 2026 Silver Institute study covering 1970 through May 2026 estimated long-run equilibrium slightly below 60:1, but the ratio remained far from it for extended periods.
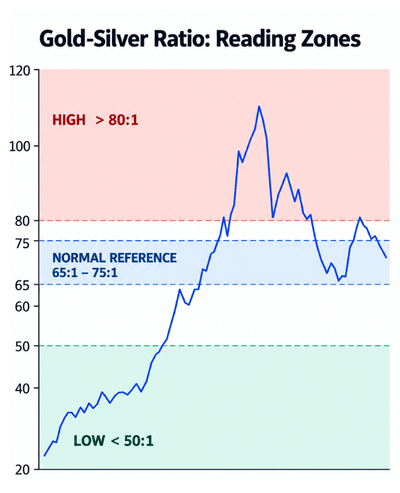
The ranges below are decision zones, not automatic entries:
1. Normal Readings Between 65:1 and 75:1
How to interpret: This range suggests no clear relative-value extreme when it is close to the investor’s historical benchmark. But it is not a permanent fair-value range.
How to act: Maintain the planned gold and silver allocation. Rebalance only when either metal’s portfolio weight moves outside its predefined allocation band.
2. High Readings Above 80:1
How to interpret: A high ratio can reflect gold strength, silver weakness or both. Safe-haven demand can support gold, while weak manufacturing demand can hold silver back and keep the ratio elevated. Silver’s greater natural abundance alone does not prove it is undervalued.
How to act: Long-term buyers may accumulate silver gradually if it fits their allocation plan. For a contraction trade, wait for the ratio to break and close below its recent uptrend boundary, supported by silver gaining strength relative to gold.
3. Low Readings Below 50:1
How to interpret: A low ratio can follow strong silver performance driven by manufacturing, investment demand or speculative buying. It can remain low while those forces persist, so the reading alone does not establish a reversal.
How to act: Physical holders may exchange part of their silver for gold, while investors may trim overweight silver exposure. For an expansion trade, wait for the ratio to break and close above its recent downtrend boundary, supported by gold gaining strength relative to silver.
How Investors and Traders Use the Ratio?
How to use the gold-silver ratio depends on the objective. Rebalancing controls allocation, a physical gold silver swap aims to increase ounces, and active trading targets expansion or contraction.
Method 1: Portfolio Allocation and Rebalancing
Gold silver ratio portfolio rebalancing should support an existing policy. The ratio can guide new contributions, but it should not replace limits on total metals exposure.
Calendar method: Review quarterly or annually, regardless of the ratio.
Band method: Trade only when a metal moves beyond a preset allocation limit.
Combined method: Review on fixed dates but act only after a band is breached.
Method 2: Exchanging Physical Gold and Silver
A higher gold-silver ratio means one ounce of gold can buy more silver ounces. A lower ratio means fewer silver ounces are needed to buy one ounce of gold. Some physical holders therefore exchange gold for silver at a high ratio, then exchange silver back for gold if the ratio falls.
Method 3: Trading Expected Ratio Expansion or Contraction
Pairs trading combines a long position in one metal with a short position in the other to target relative performance. Futures, suitable ETFs or CFDs can provide this exposure.
One specific approach uses breakouts from a recent range on the daily ratio chart. Mark support where the ratio has repeatedly stopped falling and resistance where it has repeatedly stopped rising.
Expansion: After a daily close above resistance, buy gold and sell silver.
Contraction: After a daily close below support, sell gold and buy silver.
Define the exits before entering:
Invalidation: Close both positions if the ratio closes back inside the broken range.
Target: Use the next resistance for expansion or support for contraction.
Limits: Close both positions at the predefined combined loss limit or time limit.
Allow for two spreads, financing and slippage when assessing the trade. Different volatility and execution prices mean the hedge remains imperfect.
How to Easily Execute Ratio Trading via CFDs
Short-selling physical silver is difficult, while borrowing restrictions in traditional stock accounts can complicate flexible hedging.
CFDs offer a practical solution by allowing long and short positions without owning either metal. Create a partial hedge by buying XAU/USD and selling XAG/USD for expected ratio expansion, or reversing both positions for contraction. Balanced dollar exposure can help offset shared market movements while targeting the metals’ relative performance.
Mitrade offers zero commissions, with spreads charged on trades. It also offers flexible leverage, enabling smaller capital to gain larger exposure to macroeconomic moves, and T+0 trading to open and close long or short positions within the same day.


How to Execute a Gold-Silver Ratio Trade on Mitrade
The steps below show how to buy gold and sell silver on Mitrade when you expect the gold-silver ratio to rise.
Step 1: Monitor the gold-silver ratio
The ratio can be combined with different strategies. For trend following, wait for a close above resistance and a successful retest. For mean reversion, look for a rebound from an unusually low reading; crossing below 50 alone is insufficient.
Step 2: Analyse gold and prepare the Buy order
Search for “XAU/USD” or “GOLD.” For trend following, look for an uptrend or bullish breakout; for mean reversion, a bullish reversal from support. Confirm gold’s strength relative to silver, choose a market or pending Buy order, and set the lot size and exits.
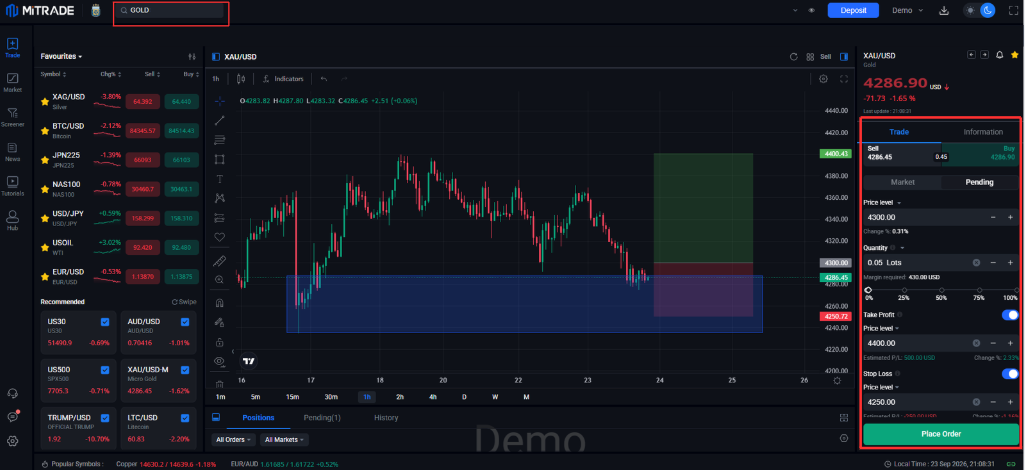
Pending Buy Order on Gold
Step 3: Analyse silver and prepare the Sell order.
Search for “XAG/USD” or “SILVER.” For trend following, look for weakness or a bearish breakout; for mean reversion, a downward reversal from resistance. Choose a market or pending Sell order and set the lot size and exits. Risk the same amount on both orders, reducing risk per position to stay within your combined limit.
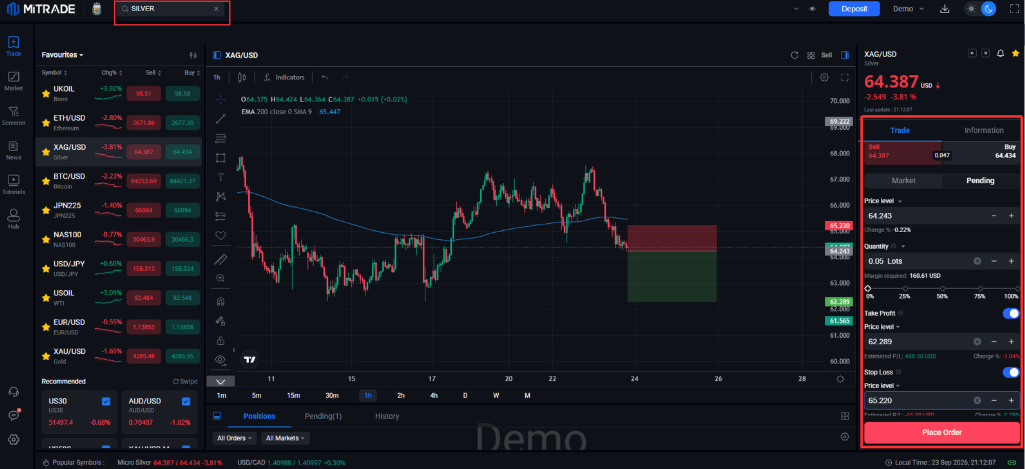
Pending Sell Order on Silver
Conclusion
The gold-silver ratio helps guide allocation, physical exchanges and relative-performance trades. Readings between 65 and 75 suggest no clear extreme, while high or low readings require confirmation from both metal charts.
Investors can use the ratio to rebalance their portfolio, exchange physical metals using dealer prices, or trade imbalances between gold and silver prices.
Mitrade’s demo account gives you access to different markets, order types, and analysis and charting tools. You can use it to practice and test strategies while using the gold-silver ratio. This allows you to refine your approach and work toward building a trading edge without risking real money.
Risk-Free Demo Account
CMA-regulated | 24х5 | 0 commission | low spreads. Enjoy limit and stop loss for every trade!
Why Does the Gold-Silver Ratio Change If Both Are Precious Metals?
Gold and silver have different uses and sources of demand. Gold is widely used for jewelry and investment, while silver serves industries such as automotive manufacturing, electronics and solar energy. Each market therefore responds differently to economic events.
For example, increased central-bank gold purchases directly raise demand for gold without creating equivalent demand for silver, which can push the ratio higher.
Why Is Silver More Volatile Than Gold?
Silver has a smaller market and combines investment demand with large industrial use. Changes in manufacturing expectations, liquidity or investor flows can therefore produce larger percentage movements than in gold.
Is a High Ratio a Reliable Indicator of an Upcoming Economic Recession?
Is the gold-silver ratio a recession indicator? It can reflect fear or weaker manufacturing, but it is not reliable alone. Central-bank gold buying, silver supply changes or investor flows can also lift the ratio without an approaching recession.
* The content presented above, whether from a third party or not, is considered as general advice only. This article should not be construed as containing investment advice, investment recommendations, an offer of or solicitation for any transactions in financial instruments.


