

Top 3 Price Prediction: Bitcoin, Ethereum, Ripple – BTC, ETH and XRP dips as Israel-Iran conflicts escalate
- Bitcoin price edges below $104,000 on Friday after falling 4% over the last two days.
- Ethereum extends its losses for the third consecutive day, signaling waning bullish momentum.
- XRP closes below its 50-day EMA support at $2.26, increasing the chances of a deeper correction.
Bitcoin (BTC), Ethereum (ETH), and Ripple (XRP) prices have dipped as escalating geopolitical tension between Israel and Iran has triggered a risk-off sentiment in the cryptocurrency markets. The top three cryptocurrencies by market capitalization are extending their losses heading into the weekend, with the price action suggesting further correction in BTC, ETH, and XRP.
Bitcoin bears take the lead
Bitcoin price failed to retest its all-time high of $111,980 following a sharp rally on Monday and declined slightly until Wednesday. It continued its correction on Thursday, closing below the daily support at $106,406. At the time of writing on Friday, it extended its losses and hovers around its 50-day Exponential Moving Average at $102,447.
If BTC closes below its 50-day EMA at $102,447, it could extend the decline to retest its psychological important level of $100,000.
The Relative Strength Index (RSI) slips below its neutral level of 50, reading 45, indicating bearish momentum. The Moving Average Convergence Divergence (MACD) indicator also displayed a bearish crossover on Thursday, issuing sell signals and indicating a downward trend.
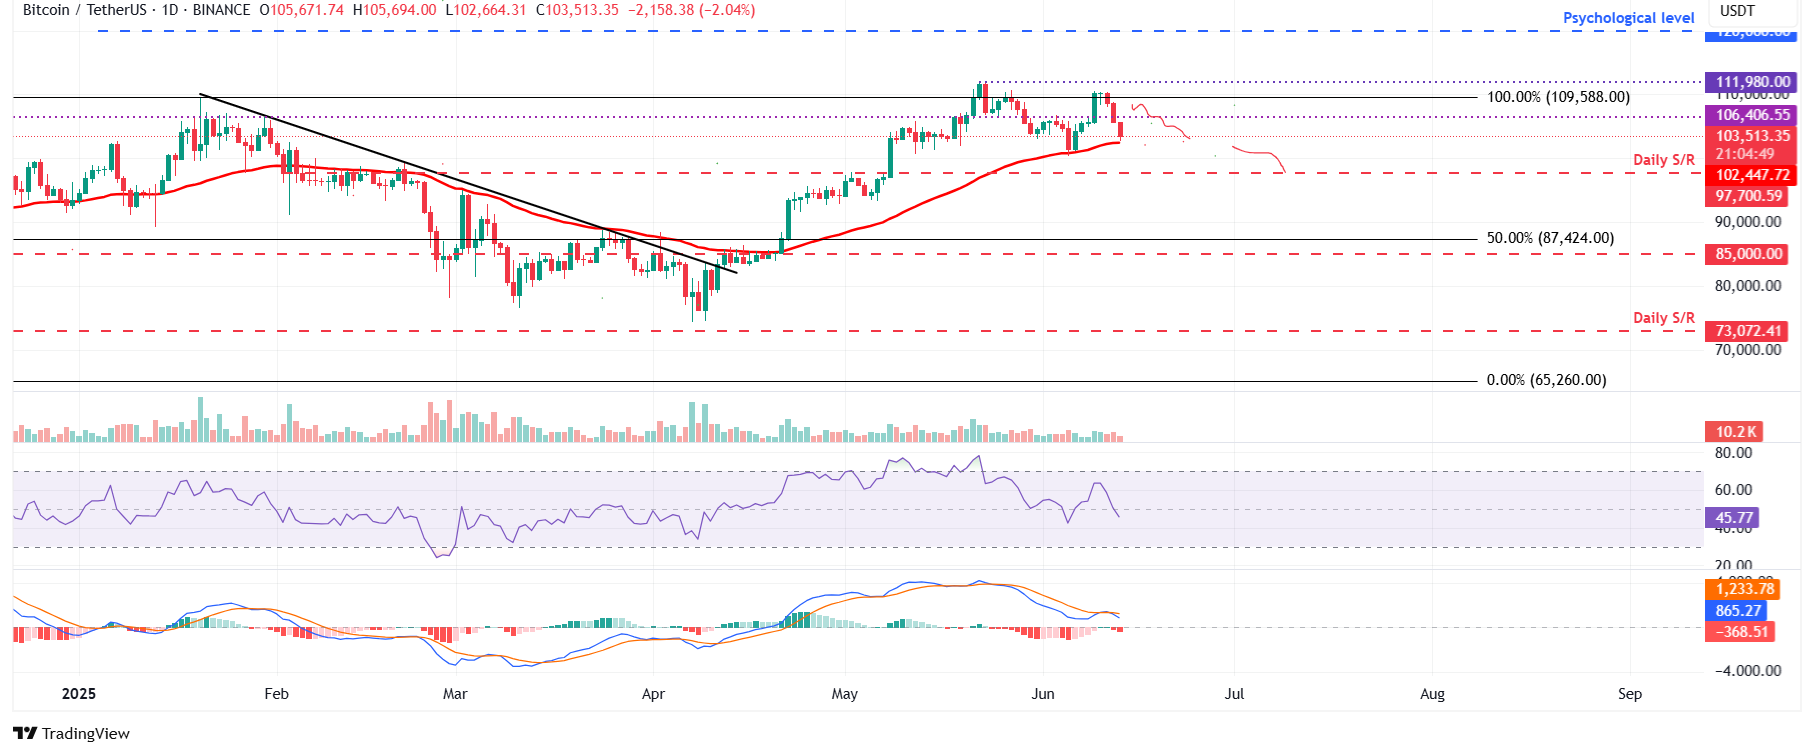
BTC/USDT daily chart
However, if BTC recovers, it could extend the recovery to retest its daily level of $106,406.
Ethereum shows weakness in momentum indicators
Ethereum price failed to find support around the upper consolidation level of $2,724 on Thursday and declined by 4.65%. At the time of writing on Friday, it trades down 6%, resting at its lower consolidation boundary of $2,461.
If ETH continues its correction and closes below its 50-day EMA at $2,410, it could extend the decline to retest its next support level at $2,000.
The RSI on the daily chart reads 47, below its neutral level of 50, indicating bearish momentum. Additionally, the MACD indicator also displayed a bearish crossover on Thursday, issuing sell signals and indicating a downward trend.
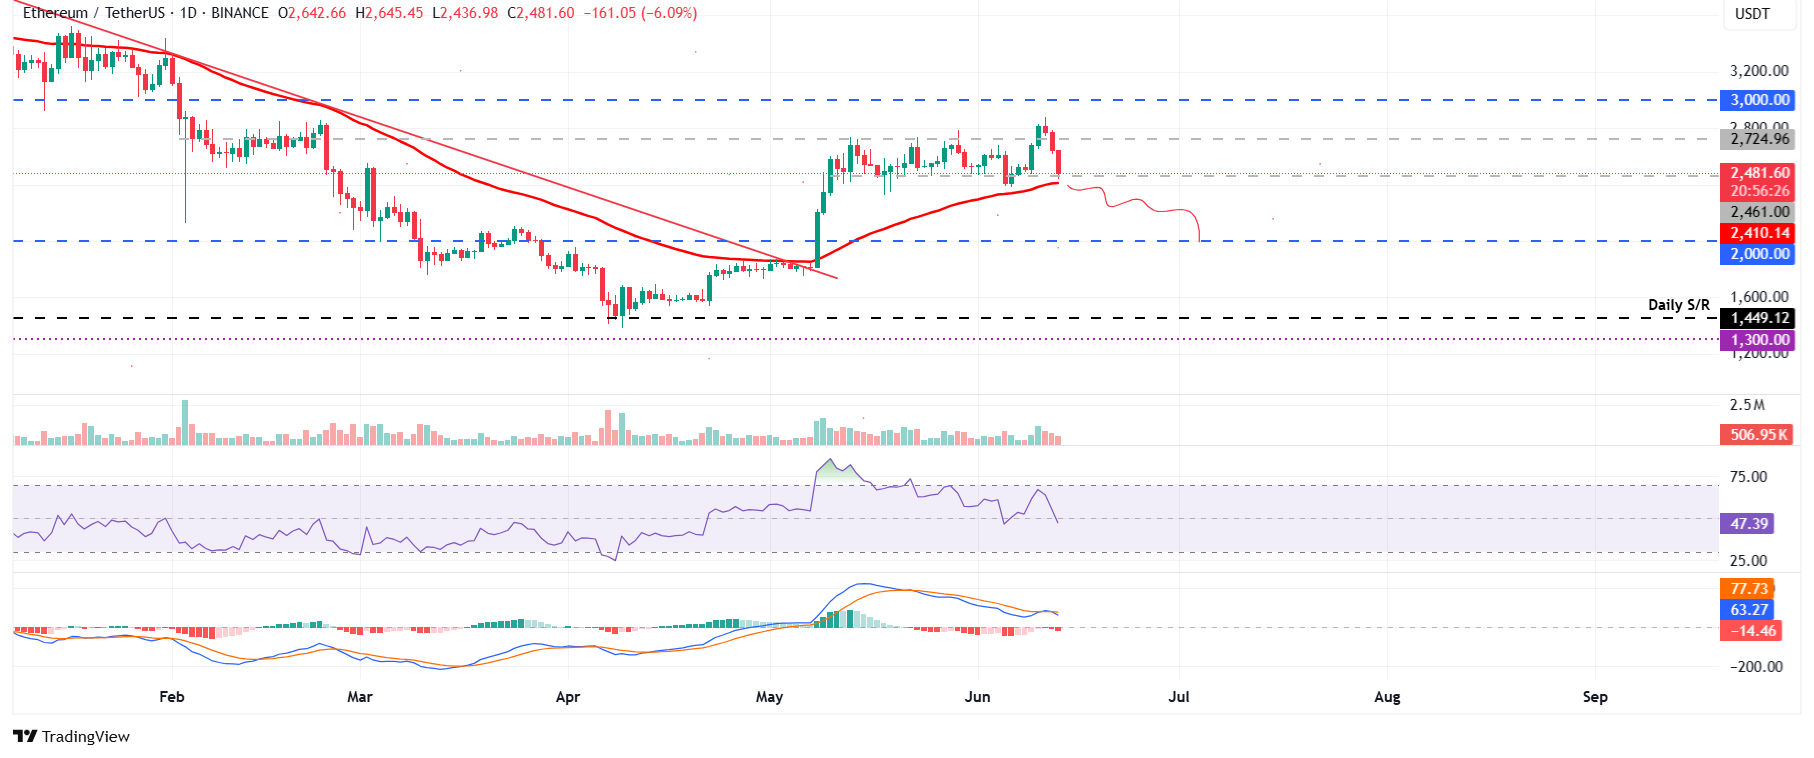
ETH/USDT daily chart
On the other hand, if ETH finds support around its lower consolidation boundary at $2,461, it could extend the recovery to retest its upper consolidation boundary at $2,724.
XRP is poised for a downleg below its 50-day EMA
XRP price closed below its 50-day EMA level at $2.25 on Thursday and declined 3.55% that day. At the time of writing on Friday, it continues to trade down by 3.5% at around $2.11.
If XRP continues its correction, it could extend the decline to retest its next daily support level at $1.96.
The RSI on the daily chart reads 40, below its neutral level and points downward, indicating strong bearish momentum. Moreover, the two lines of the Moving Average Convergence Divergence (MACD) indicator on the daily chart coil around each other, indicating indecisiveness among traders. If the MACD flips a bearish crossover, it will give a sell signal and further support the bearish thesis.
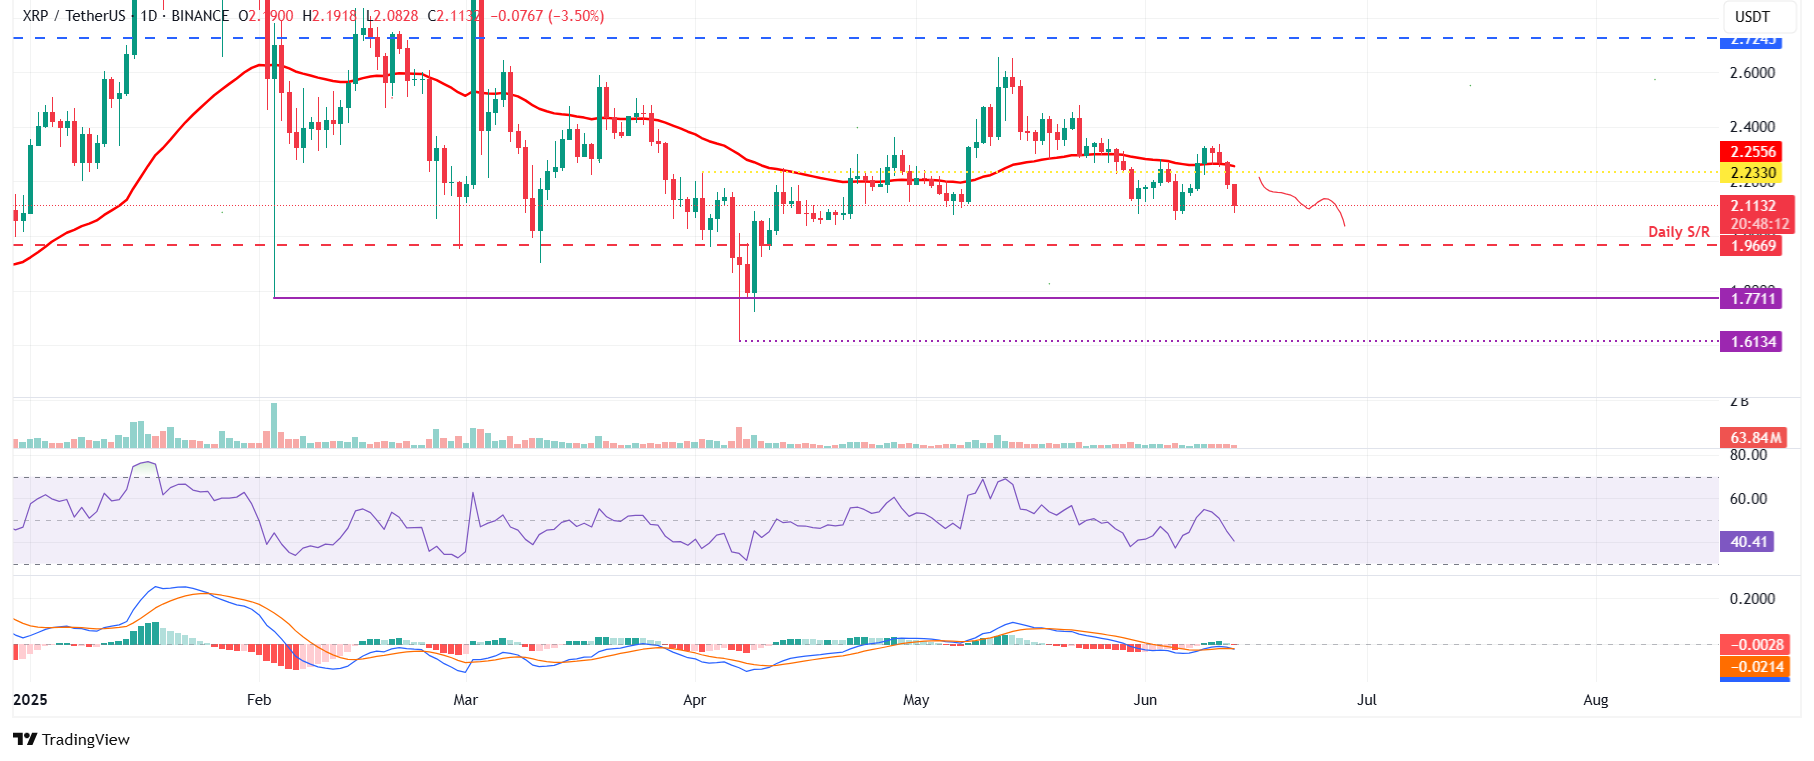
XRP/USDT daily chart
Conversely, if XRP recovers, it could extend to retest its 50-day EMA at $2.25.
Bitcoin, altcoins, stablecoins FAQs
Bitcoin is the largest cryptocurrency by market capitalization, a virtual currency designed to serve as money. This form of payment cannot be controlled by any one person, group, or entity, which eliminates the need for third-party participation during financial transactions.
Altcoins are any cryptocurrency apart from Bitcoin, but some also regard Ethereum as a non-altcoin because it is from these two cryptocurrencies that forking happens. If this is true, then Litecoin is the first altcoin, forked from the Bitcoin protocol and, therefore, an “improved” version of it.
Stablecoins are cryptocurrencies designed to have a stable price, with their value backed by a reserve of the asset it represents. To achieve this, the value of any one stablecoin is pegged to a commodity or financial instrument, such as the US Dollar (USD), with its supply regulated by an algorithm or demand. The main goal of stablecoins is to provide an on/off-ramp for investors willing to trade and invest in cryptocurrencies. Stablecoins also allow investors to store value since cryptocurrencies, in general, are subject to volatility.
Bitcoin dominance is the ratio of Bitcoin's market capitalization to the total market capitalization of all cryptocurrencies combined. It provides a clear picture of Bitcoin’s interest among investors. A high BTC dominance typically happens before and during a bull run, in which investors resort to investing in relatively stable and high market capitalization cryptocurrency like Bitcoin. A drop in BTC dominance usually means that investors are moving their capital and/or profits to altcoins in a quest for higher returns, which usually triggers an explosion of altcoin rallies.
บทความแนะนำ


