

Bitcoin is 23% away from ATHs, but retail is still not here, why?
- Bitcoin price is 23% away from the all-time high of $69,000.
- Retail investors seem to be absent despite BTC’s 242% rally in the last 15 months.
- Investors should exercise caution if the pioneer crypto fails to breach the $52,000 to $53,000 hurdle.
Bitcoin’s journey so far has been nothing short of shocking. From ETF approval to countries warming up to crypto regulation, the crypto landscape seems to have changed quite a bit. Retail, which was a major driver of the bull runs so far, seems to be absent this cycle; a quick Google Trends search reveals low interest.
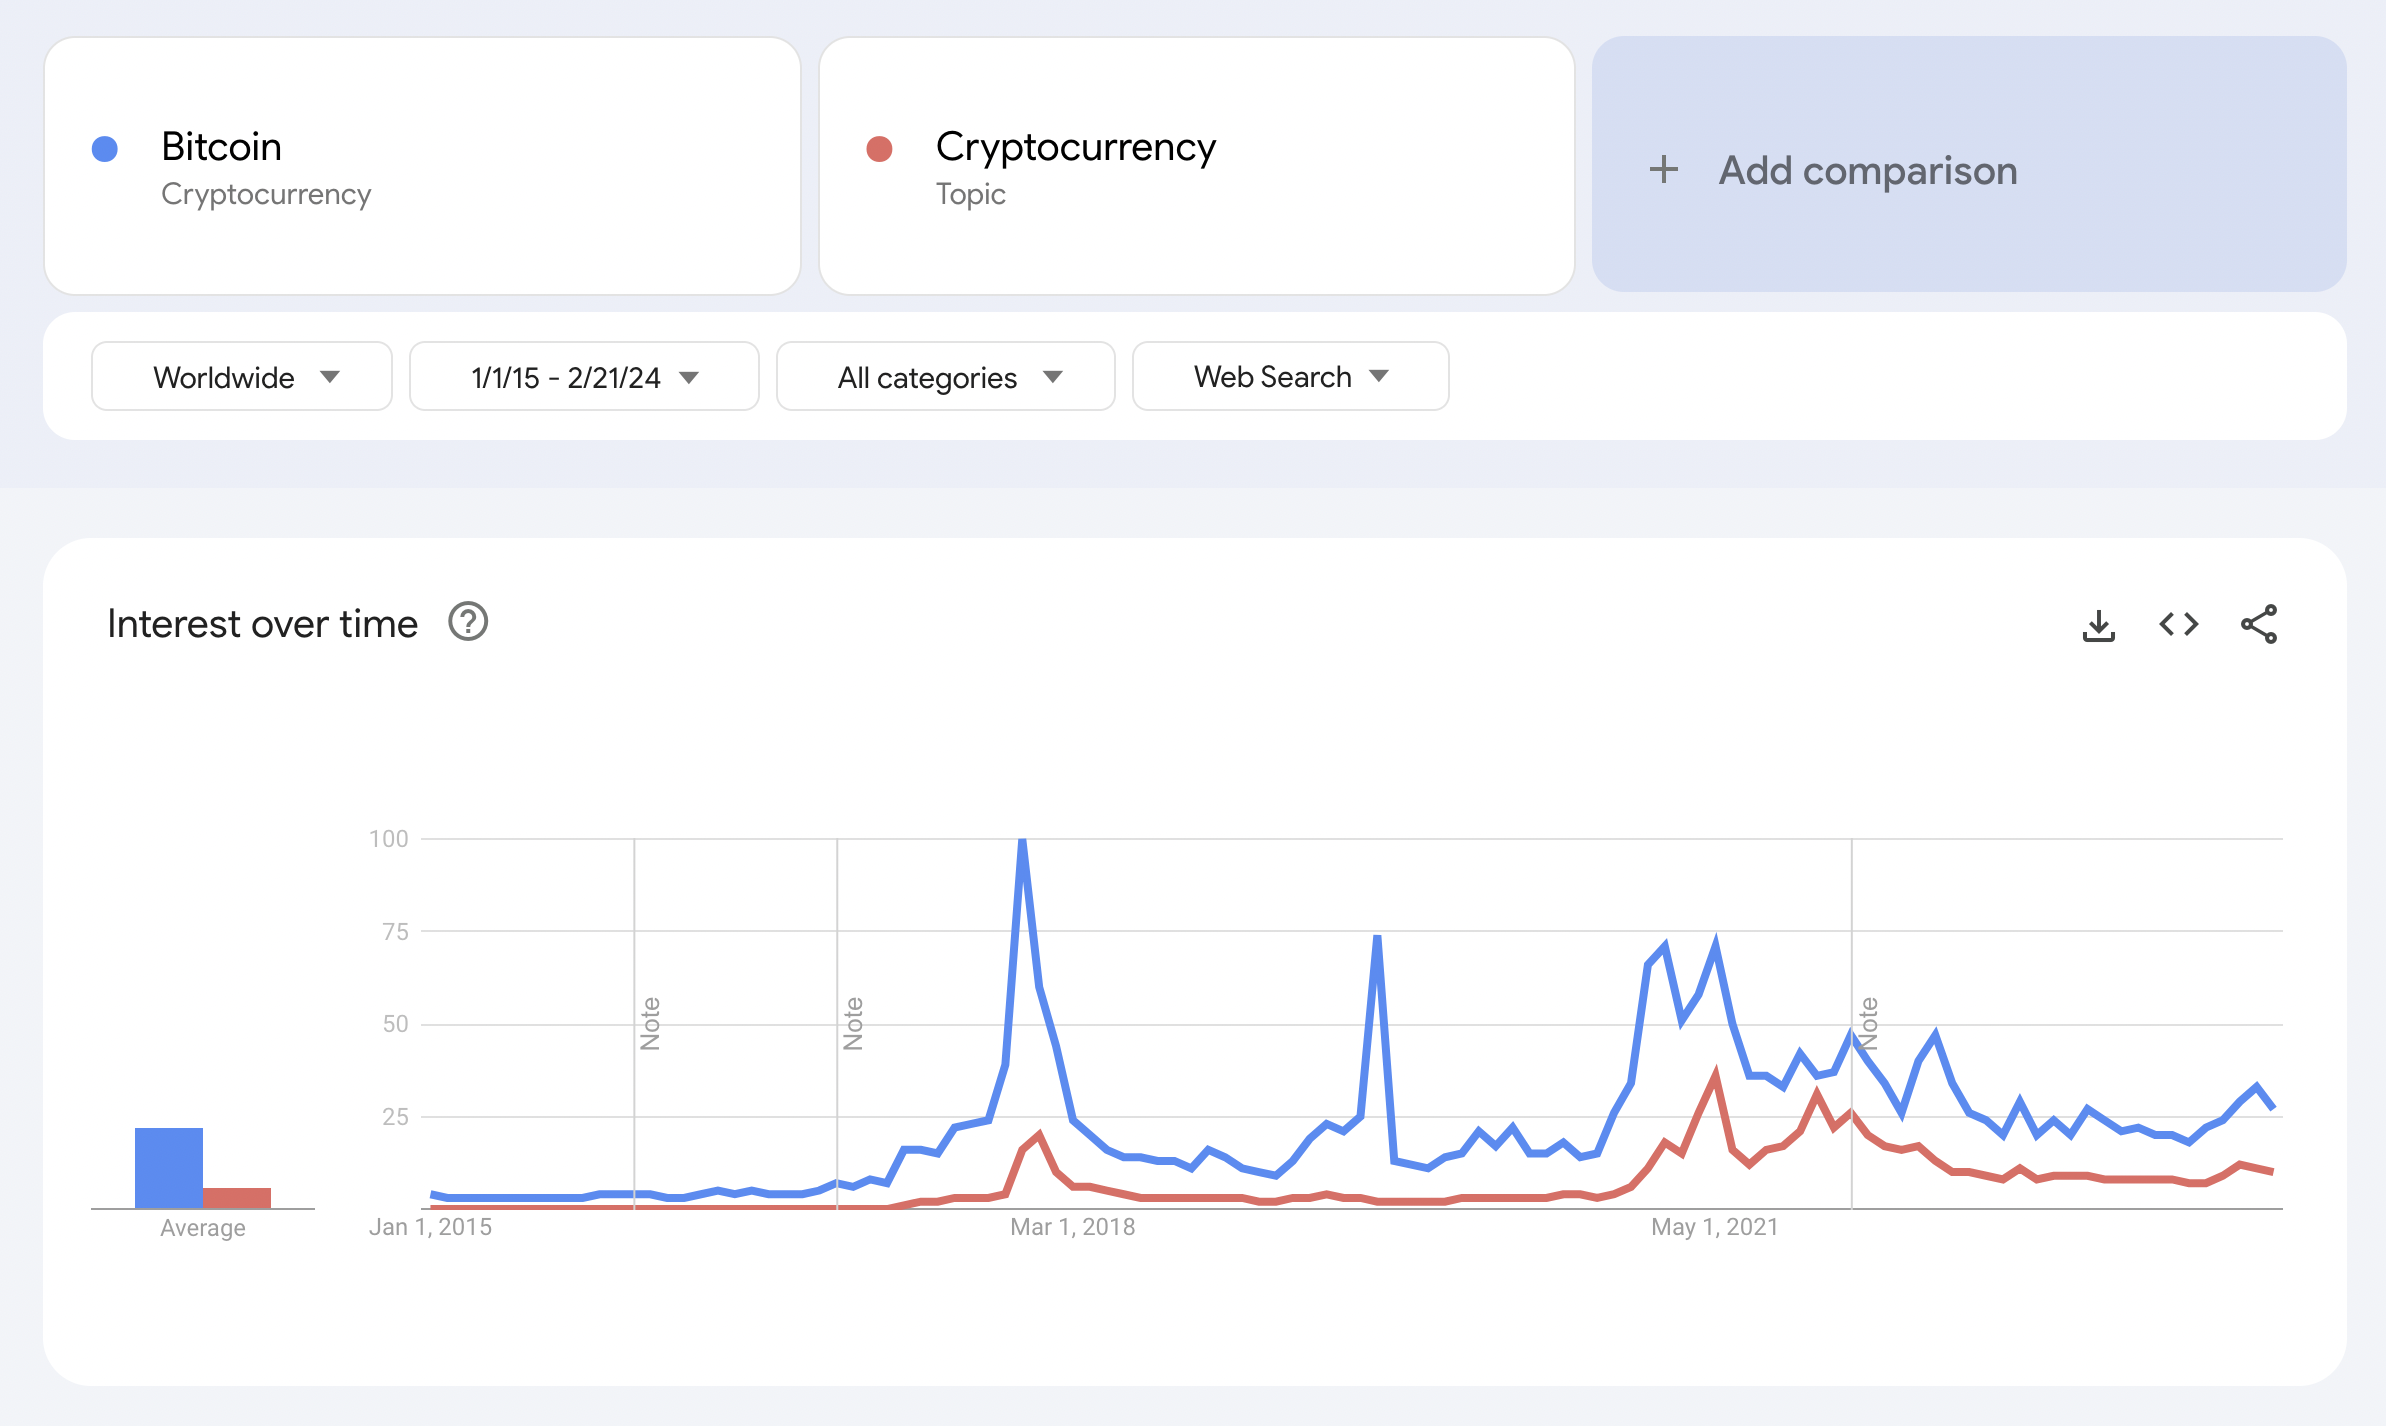
Google Trends
Relying solely on Google Trends is not enough due to the changing landscape of how users access information. According to Coinbase’s recent earnings report, retail activity stayed low in Q4 of 2023. To be more specific, the retail activity between Q2 2022 to Q4 2023 remained below Q4 2020, which adds more credence that the retail is not here yet.
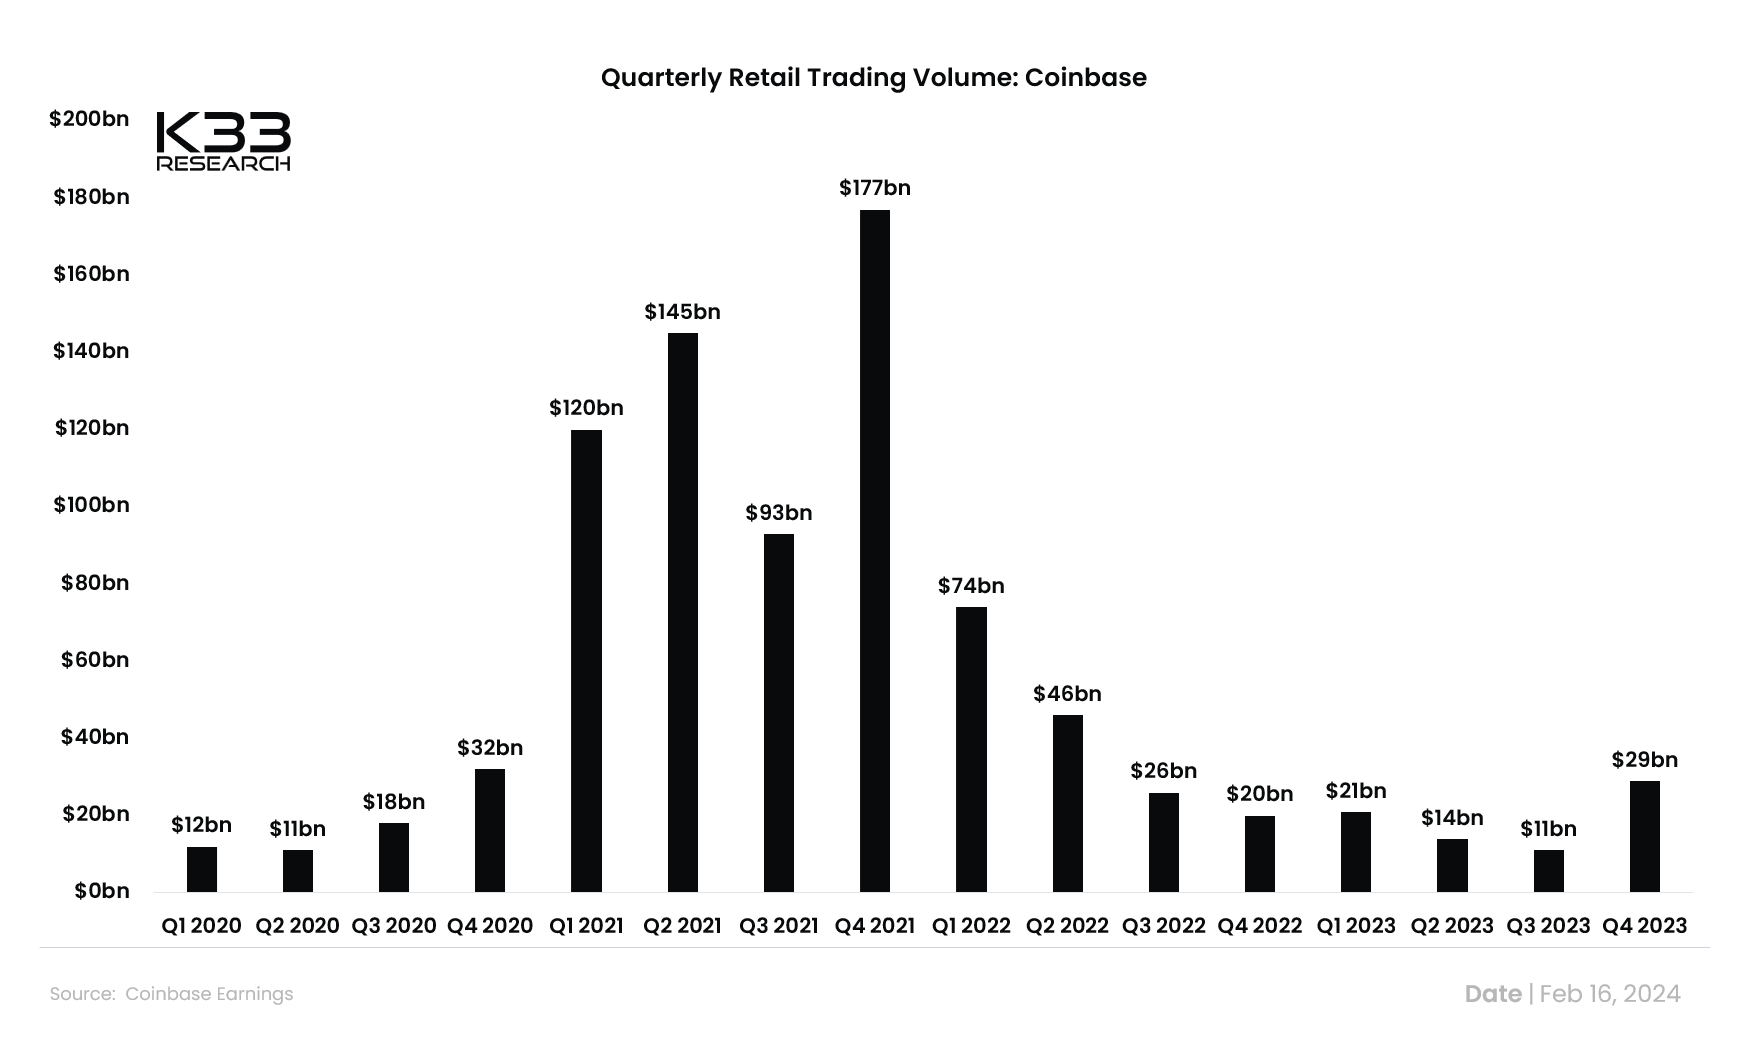
Coinbase quarterly retail activity
Also read: Bitcoin Price Prediction: $160 million long positions liquidated as BTC slips 2%
Reasons why retail investors are not here yet
Here are a few reasons that could account for the lack of retail involvement.
- Retail wounds are fresh: Terra Luna crash coupled with wounds from the FTX Bankruptcy is still fresh. Many investors from the 2021 crash are still not made whole, which could be deterring them from reinvesting.
- Hard-hitting regulations: Despite improved regulatory clarity and multiple onboarding methods, regulations still deter retail investors from entering the cryptocurrency landscape.
- Cryptocurrency has lost its allure: For the five to ten years, cryptocurrencies were in the spotlight with the “future of finance” being a major narrative that attracted investors. But the recent developments in the field of Artificial Intelligence (AI) seem to be siphoning retail investors’ attention.
- New cycle altogether: The approval of Bitcoin spot ETF makes this cycle different than the rest since institutions can now get direct exposure to crypto assets. Considering retail investors’ thought process, they’d be the last to enter the markets. In such a case, the ongoing rally could just be an institutional accumulation phase, and retail investors could arrive once BTC crosses its previous all-time high at $69,000.
While all or some of the above could be true, let’s elaborate on the fourth point.
A different cycle: The ETF effect
Assuming that this cycle is different, let’s take a look at the Bitcoin price chart and discuss what to expect next.
If the cycle is different due to the approval of Bitcoin spot ETF, then the ongoing move could be an accumulation phase. In this case, retail will likely enter at or after overcoming the all-time high (ATH) of $69,000.
This outlook spawns two questions.
- Will Bitcoin price continue to ascend at a similar rate? If yes, then retail is likely going to make a comeback soon, and Bitcoin will zoom past $69,000 and potentially eye a retest of $100,000 or higher.
- Will there be a slowdown in the ascent, leading to consolidation or even a correction? If yes, then how low can the Bitcoin price go?
Despite being only 23% away from the ATHs, the institutional accumulation phase could last longer, especially if BTC corrects
Also read: Bitcoin order books are most liquid since October as market depth nears $540m
Nostalgia of the 2019 mini-cycle
The 2019 mini cycle pushed Bitcoin price from a cycle low of $3,124 to $13,870, i.e., BTC was roughly 30% away from its all-time high. After forming this local top, there was a slow bleed that corrected to $3,880.
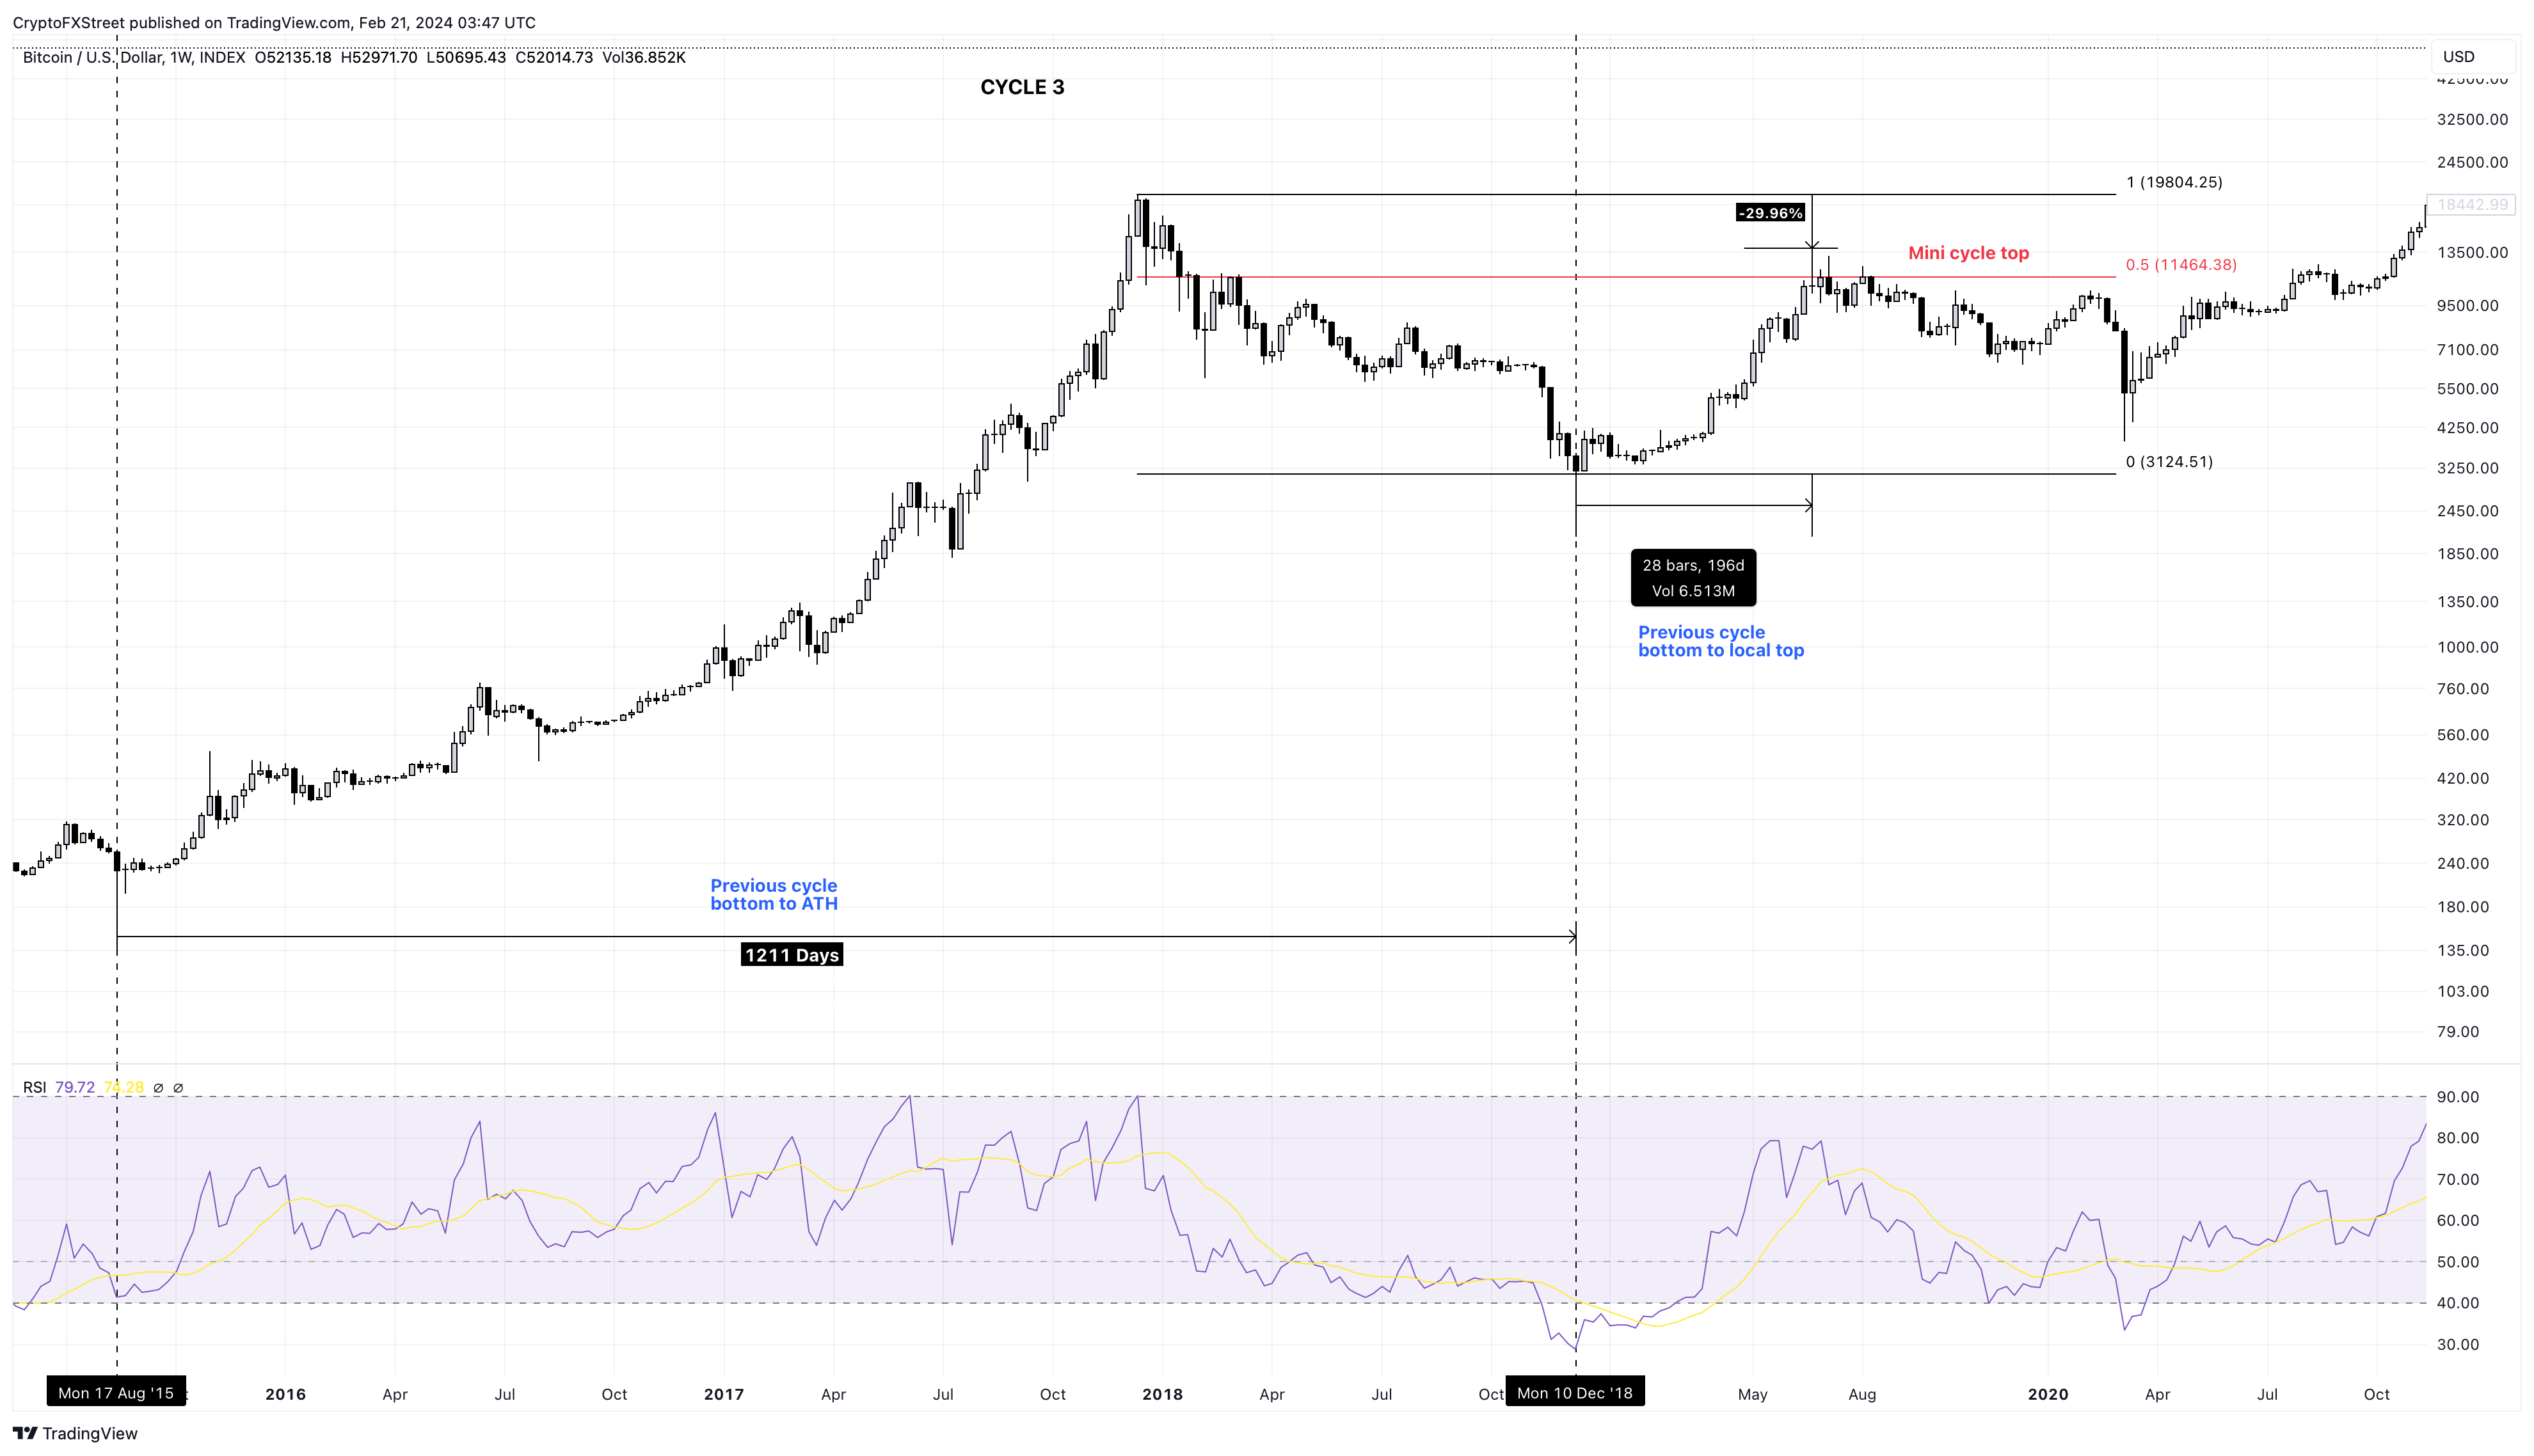
BTC/USD 1-week chart
Bitcoin price has rallied 242% from the previous cycle’s low of $15,473 and set up a local top of $53,000, i.e., it is roughly 24% away from its all-time high of $69,000. While history may not repeat, it often rhymes. Hence, there is still a chance this uptrend could form a local top at roughly $53,000 and correct lower.
The correction could send BTC to $42,235, which is the midpoint of the previous bear market’s range. Although unlikely, investors should exercise caution on the breakdown of the aforementioned level. This bearish development could send Bitcoin price to the next key support level of $32,293.
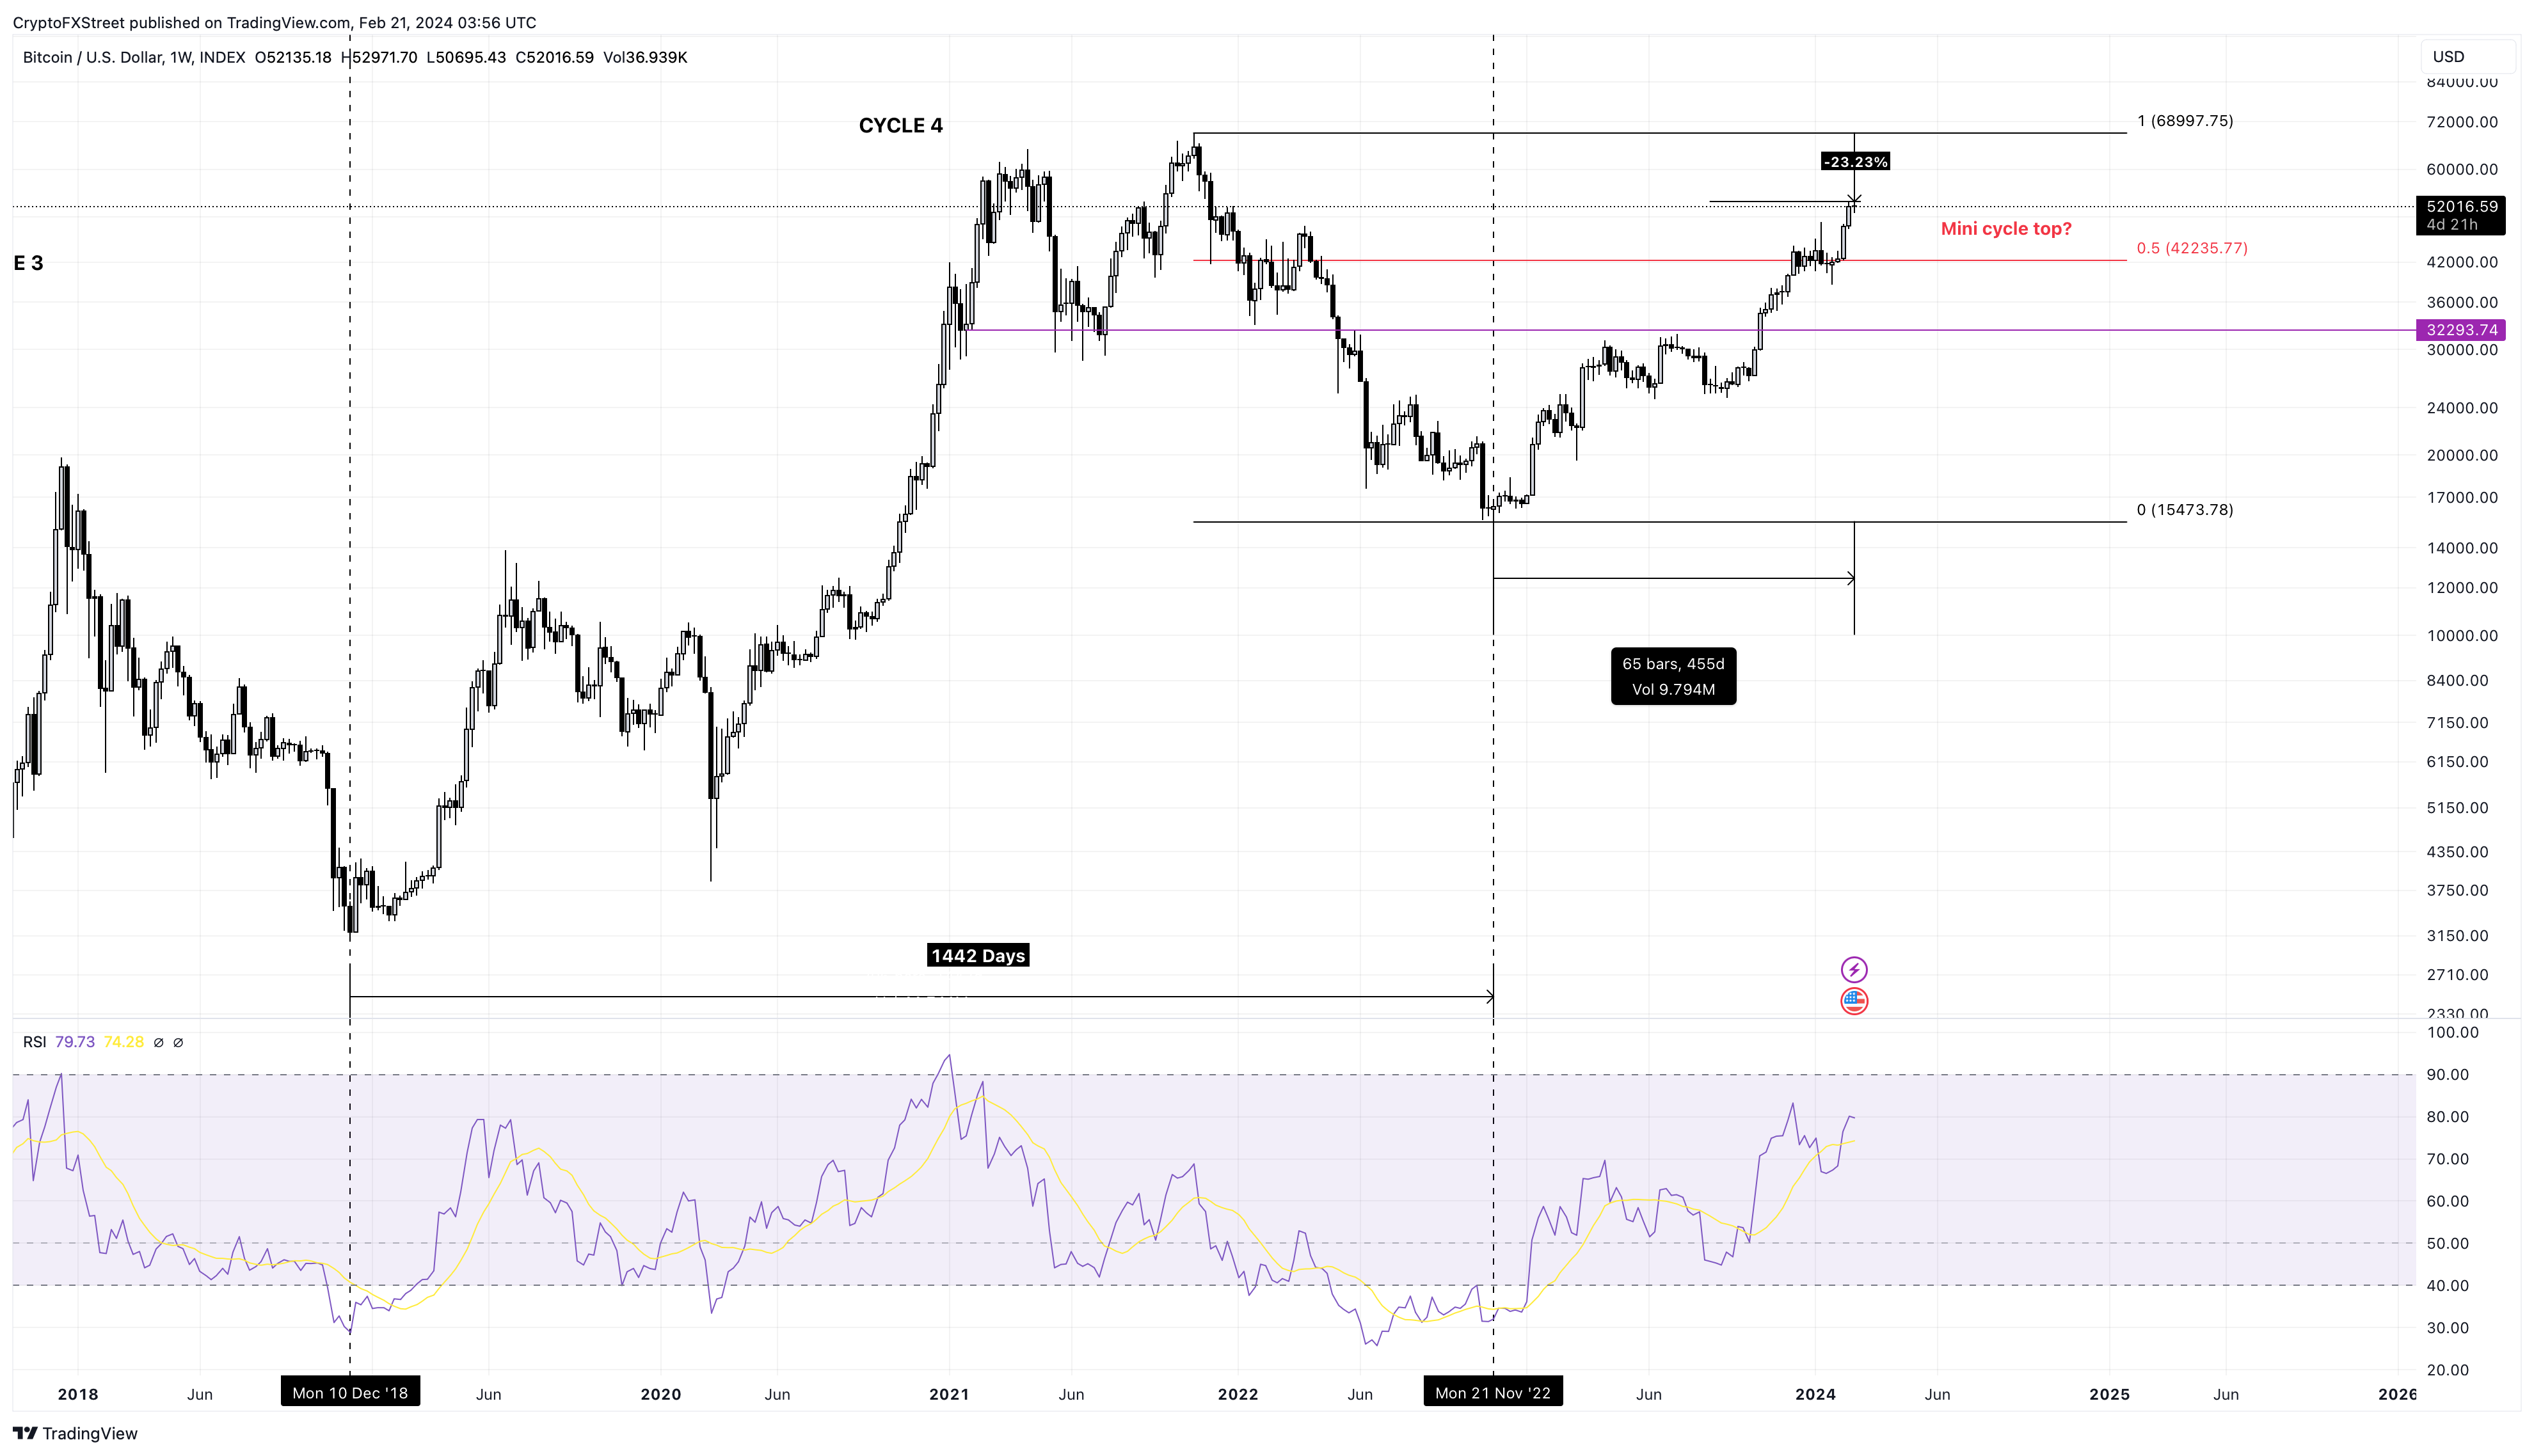
BTC/USD 1-week chart
Concluding thoughts
While a corrective outlook is highly unlikely, it should not be overlooked. Overcoming the $52,000 to $53,000 hurdle will open up the path for Bitcoin price to reach $60,000 and then attempt a retest of the all-time high at $69,000. Beyond this level, BTC will enter price discovery mode, where it will be free from shackles and completely reliant on investors sentiment and capital inflows.
บทความแนะนำ


