

Cardano Price Forecast: ADA in survival mode as retail demand wanes
- Cardano drops below $0.2800 on Monday, extending the 4% decline from the $0.3000 resistance on the previous day.
- Derivatives data shows a decline in Open Interest and a negative flip in funding rates as sentiment shifts bearish.
- The technical outlook remains mixed, with ADA holding above the 50-period EMA on the 4-hour chart.
Cardano (ADA) is trading below $0.2800 at press time on Monday, after a 4% decline the previous day. Retail interest in ADA remains low at the start of this week, as evidenced by falling Open Interest and negative funding rates. Technically, Cardano is holding its ground at a crucial crossroads as momentum downshifts into neutral gear.
Cardano struggles to remain in the crypto market spotlight
Cardano is losing retail demand, which was prompted by the LayerZero integration plan and the Midnight mainnet release in March, announced by its founder, Charles Hoskinson, on Thursday at Consensus Hong Kong 2026, hosted by CoinDesk.
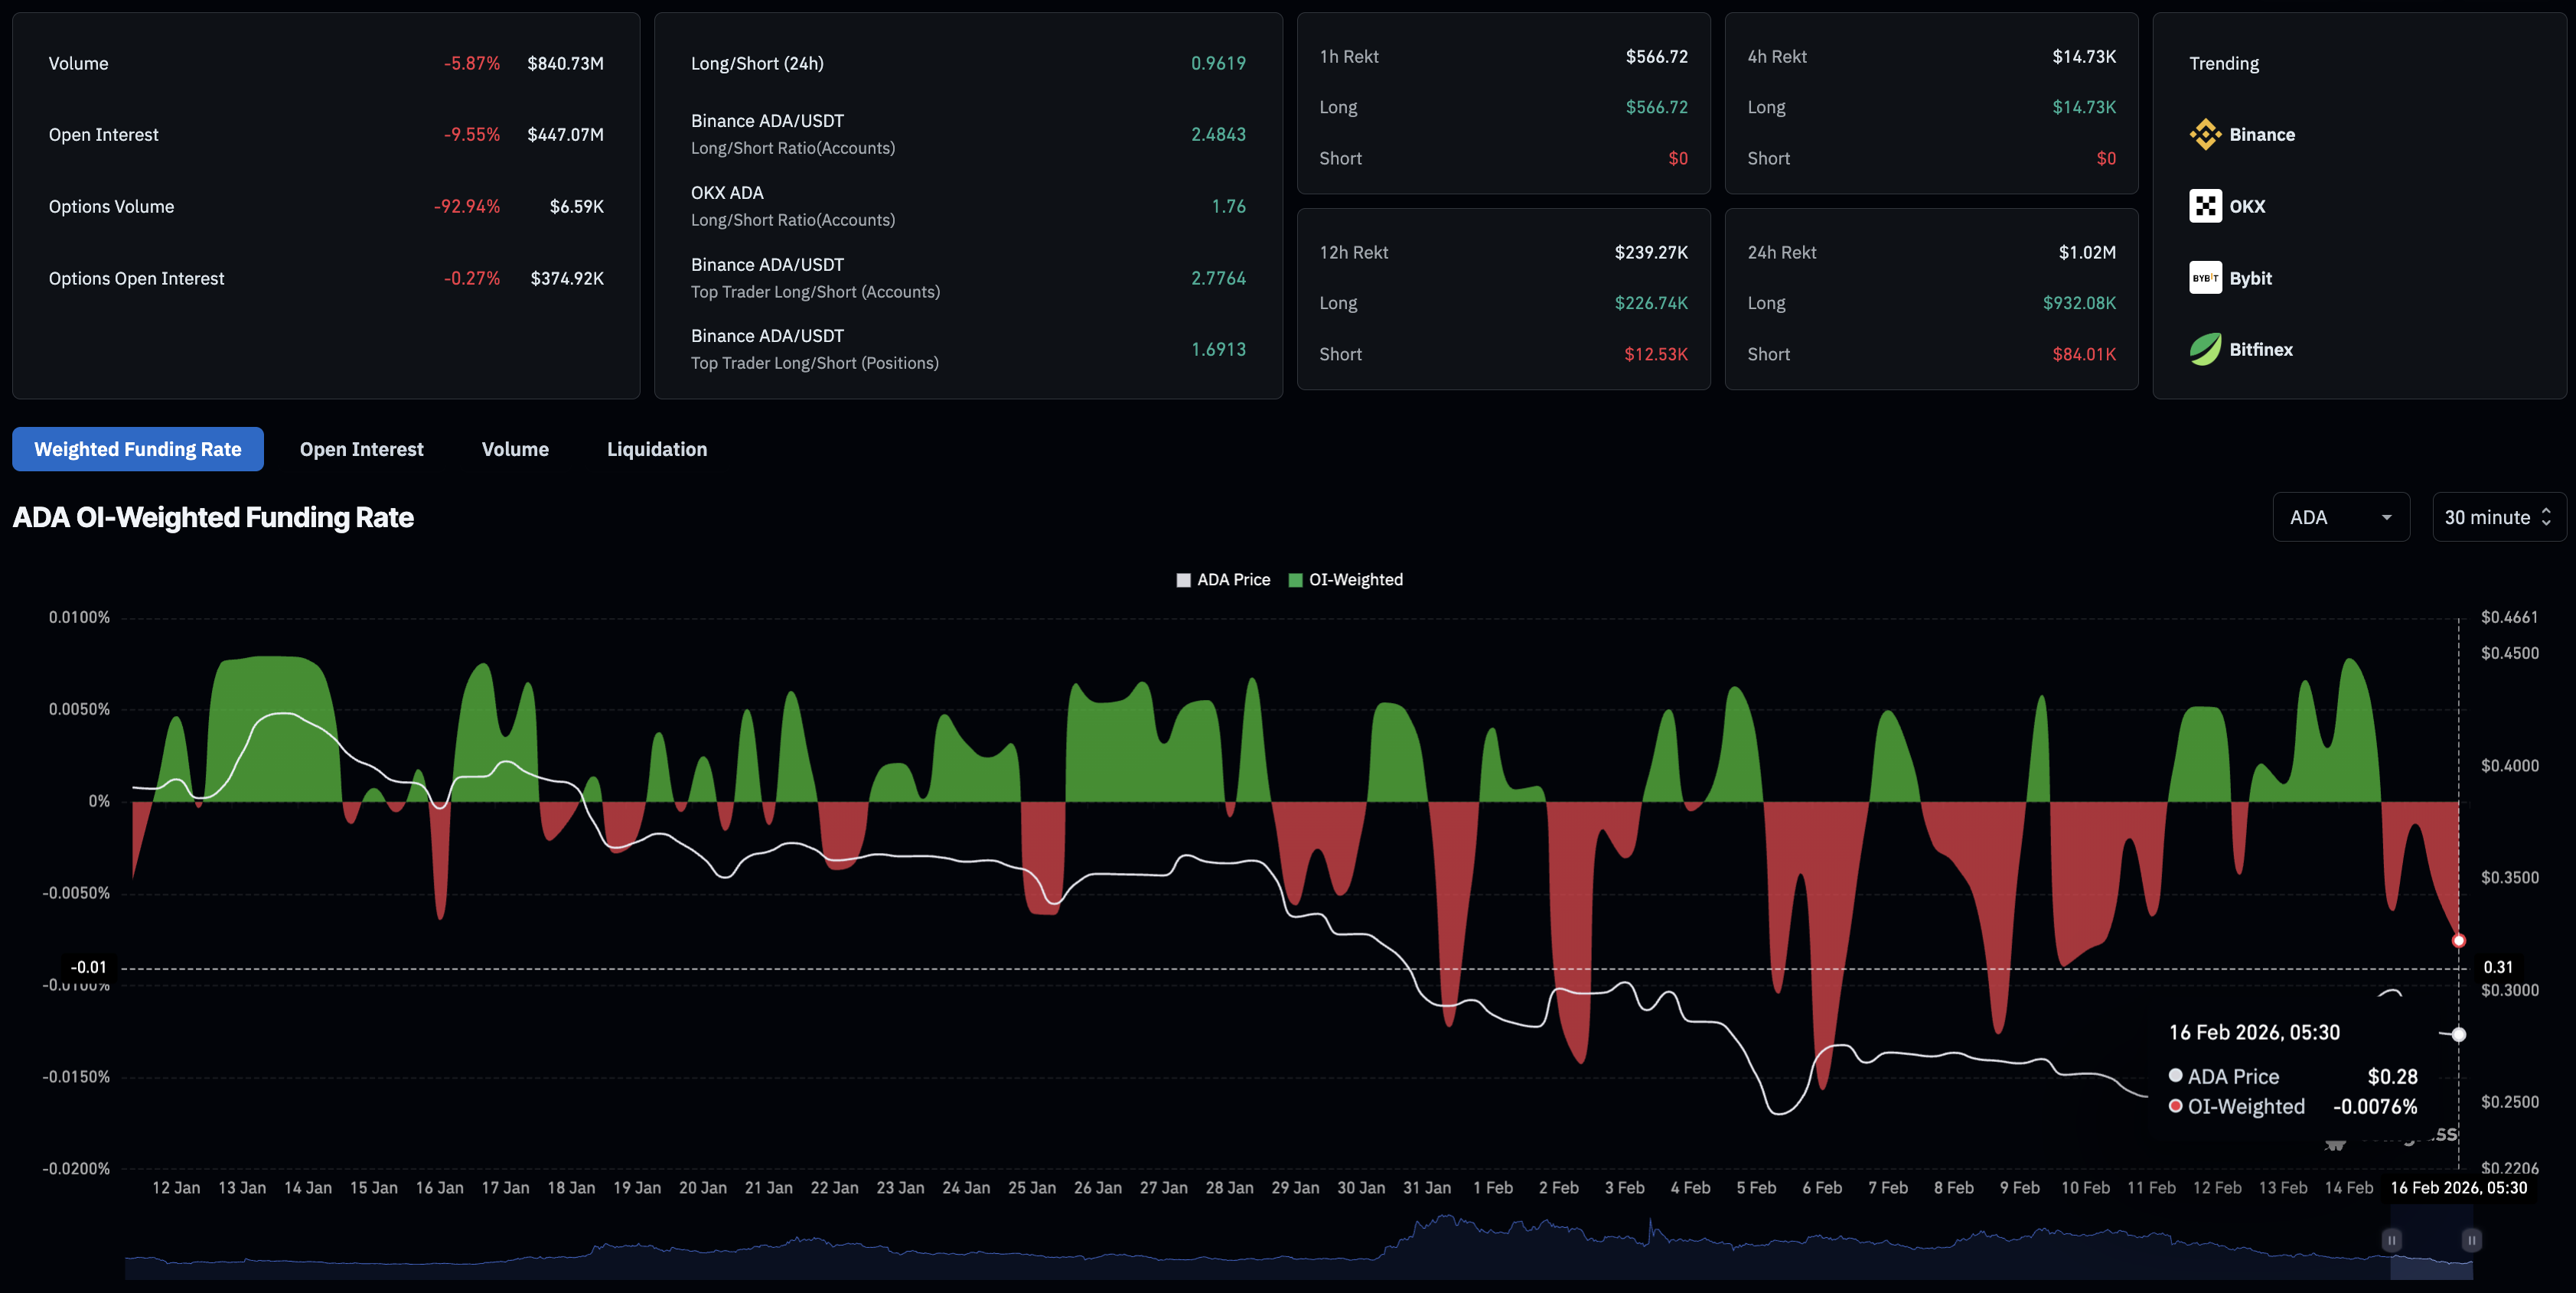
CoinGlass data indicate that the ADA futures Open Interest (OI) declined to $447.07 million, a 9.55% drop over the last 24 hours, reflecting substantial outflows from ADA derivatives, likely triggered by liquidation waves. During the same period, long liquidations totaled $932,080, significantly higher than short liquidations of $84,010, suggesting a pronounced wipeout of bullish positions. This reduced the long-to-short ratio below 1, at 0.9619, indicating a greater number of active short positions in ADA derivatives.
Additionally, the funding rate of -0.0076% indicates that traders are bearish, as evidenced by the premium imposed to hold short positions, which is necessary to balance spot and swap market prices. Otherwise, intense downward pressure in the derivatives market could drive swap prices significantly below spot market prices.
Technical outlook: Will Cardano extend its decline?
After losing its position among the top 10 cryptocurrencies by market capitalization, Cardano has struggled to regain strength. At the time of writing, ADA hovers above the 50-period Exponential Moving Average (EMA) at $0.2772 on the 4-hour chart on Monday, which serves as the short-term support level. Still, the downward slope in the 200-period EMA at $0.3129 asserts a bearish bias.
If ADA slips below $0.2772, it could test the 50% retracement level at $0.2669, measured from the February 3 high of $0.3050 to the February 6 low at $0.2289.
The Moving Average Convergence Divergence (MACD) crosses below the signal line on the 4-hour chart earlier in the day, suggesting renewed bearish momentum. The negative histogram widens below the zero line, confirming that the sellers have regained trend control.
The Relative Strength Index (RSI) is at 52 on the same chart, flattening as it approaches the midline, indicating stabilizing momentum following a recent recovery run.
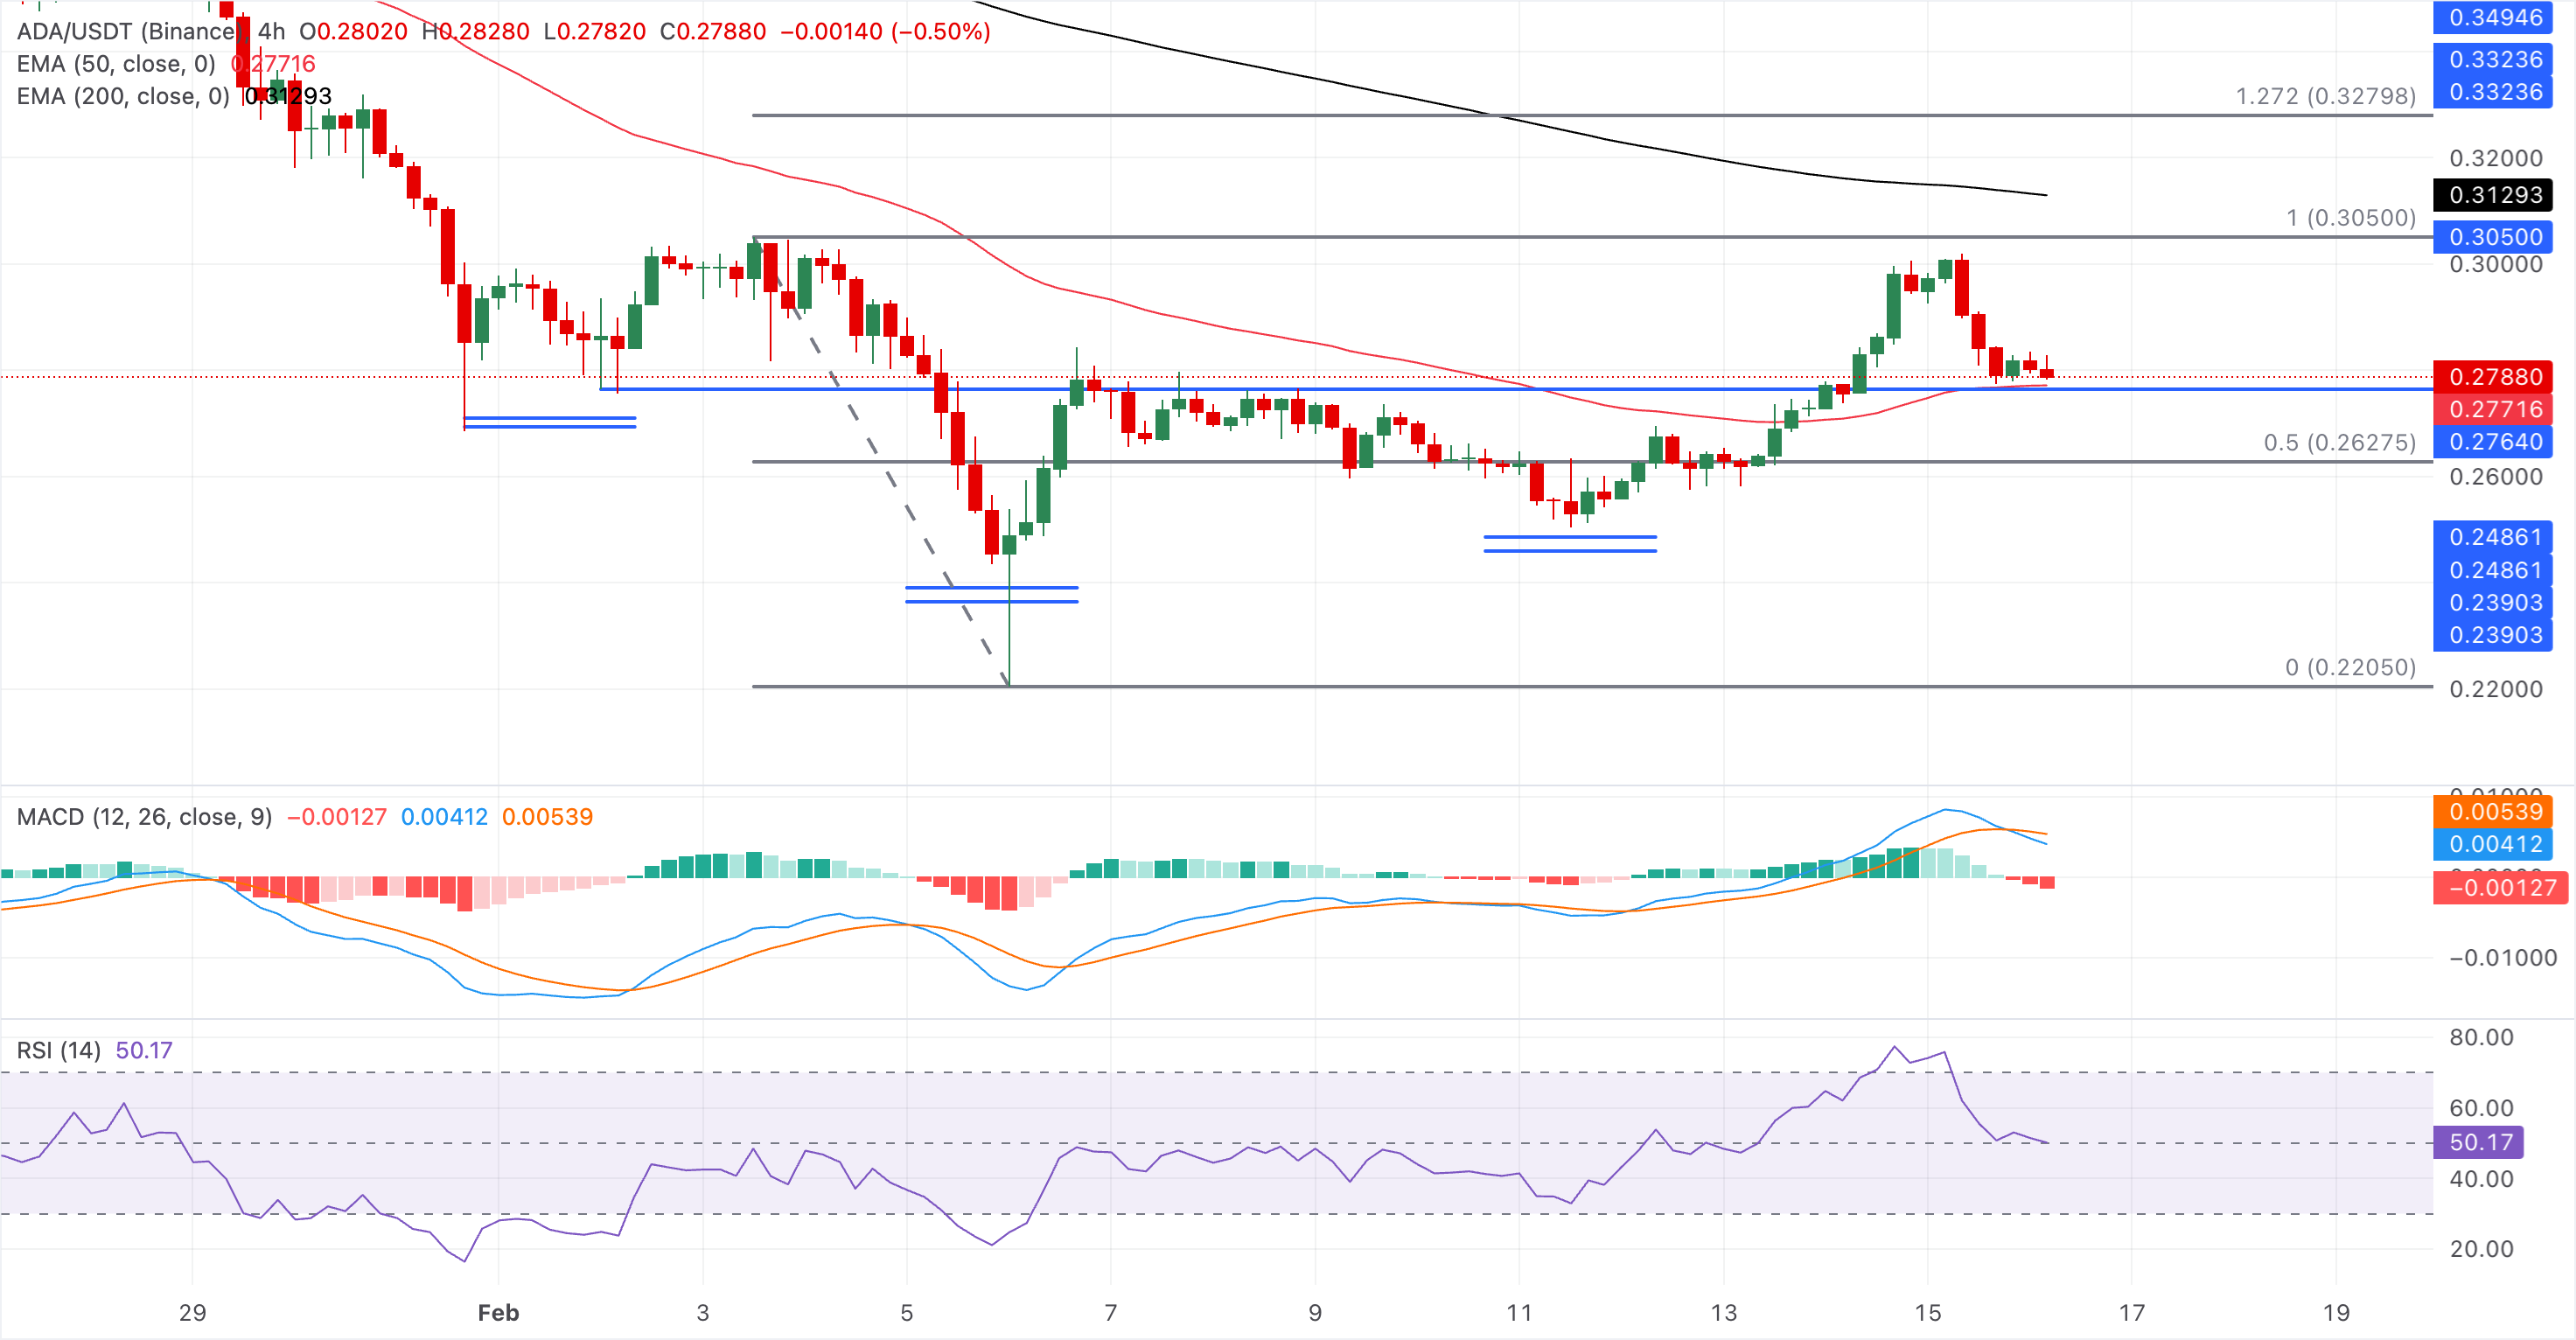
However, the recent higher-low formation and the breakout above the $0.2764 resistance level, which capped the February 6 rebound, keep the upside bias on the table. For a sustained recovery, ADA should exceed the $0.3050 level, which would open the door to the 200-period EMA at $0.3129 and the 1.272 Fibonacci extension level at $0.3279.
บทความแนะนำ


