


Dogecoin price could make a 15% recovery as DOGE market attempts to determine a bottom
- Dogecoin price dipped nearly 15% after the Friday crypto market bloodbath.
- DOGE could make a 15% recovery if Bitcoin price shows strength again.
- While a slip below $0.1606 would negate the thesis, the hammer candle is a caveat.
Dogecoin (DOGE) price led the meme coin sector dip as markets followed the Bitcoin (BTC) price south in the Friday bloodbath. With markets still in a state of optimism ahead of the BTC halving, the correction could give traders a chance to buy DOGE at a discount ahead of the anticipated event.
Also Read: Doge contributor warns of extreme volatility amid Coinbase listing of DOGE and PEPE futures products
Dogecoin price attempts bottom determination
Dogecoin price is down by nearly 15% in the wreckage of the Bitcoin price dump. With it, altcoins and meme coins in particular are down significantly, some as deep as -20% in losses. However, the dump has not reversed the cryptocurrency market sentiment as the second quarter (Q2) of 2024 catches steam. With all eyes peeled on the having, the sector has much to look forward to in the next seven days and then the next several months after that.
Meanwhile, Dogecoin price remains above a crucial support level, demarcated by the ascending trendline. With this support threshold providing a notable buying opportunity twice before, it could be the jumping-off point for DOGE, especially with a hammer candle in play.
For the layperson, a hammer candle is a bullish reversal pattern characterized by a small body at the top of the candle and a long lower shadow or wick resembling a hammer. It manifests when the asset’s price has been dropping, with its appearance showing that particular market is attempting to determine a bottom with sellers capitulating.
It also suggests that buyers are starting to step in and push the price back up. This can be a signal for traders to consider going long or buying the asset. Accentuating this bullish technical formation with the Relative Strength Index (RSI) outlook supports the bullish thesis. Notice the RSI is defending the 45 level, a move that has been seen before March 19, indicated with purple highlights on the RSI chart below.
If the RSI holds above 45, the Dogecoin price recovery could ensue, with the Bitcoin of meme coins likely to retrace back to the 50% Fibonacci placeholder at $0.1946. This would constitute a 15% move above current levels. The Awesome Oscillator (AO) still holding in positive territory reinforces the above thesis.
A show of strength in the Bitcoin price could encourage more buy orders, capable of catapulting the Dogecoin price to reclaim the $0.2287 local top. Reclaiming the $0.2100 threshold decisively would be the first sign.
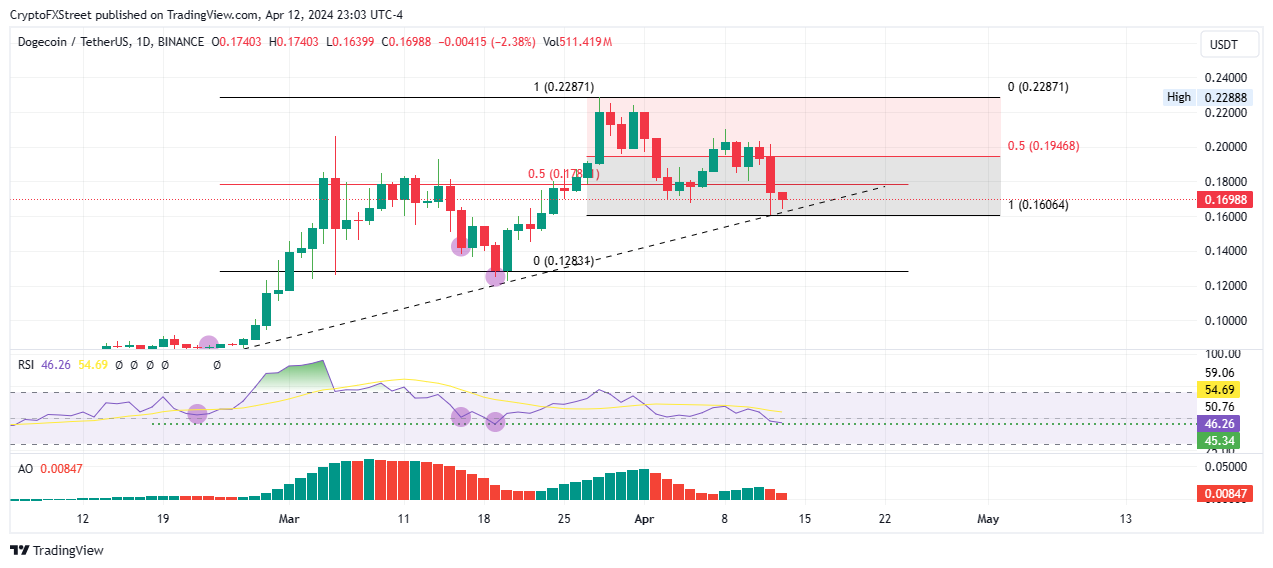
DOGE/USDT 1-day chart
On the other hand, if selling pressure increases, Dogecoin price could slip below $0.1606, not only negating the bullish thesis but also increasing the odds for further downside, potentially as low as the $0.1283 support. Such a move would denote a 25% drop below current levels.
บทความแนะนำ


