Solana Price Forecast: SOL hits key resistance ahead of Bitwise, Grayscale Solana ETFs launch

แหล่งที่มา Fxstreet
  • Solana trades above $200 with over 1% intraday gains, aiming to surpass a supply zone. 
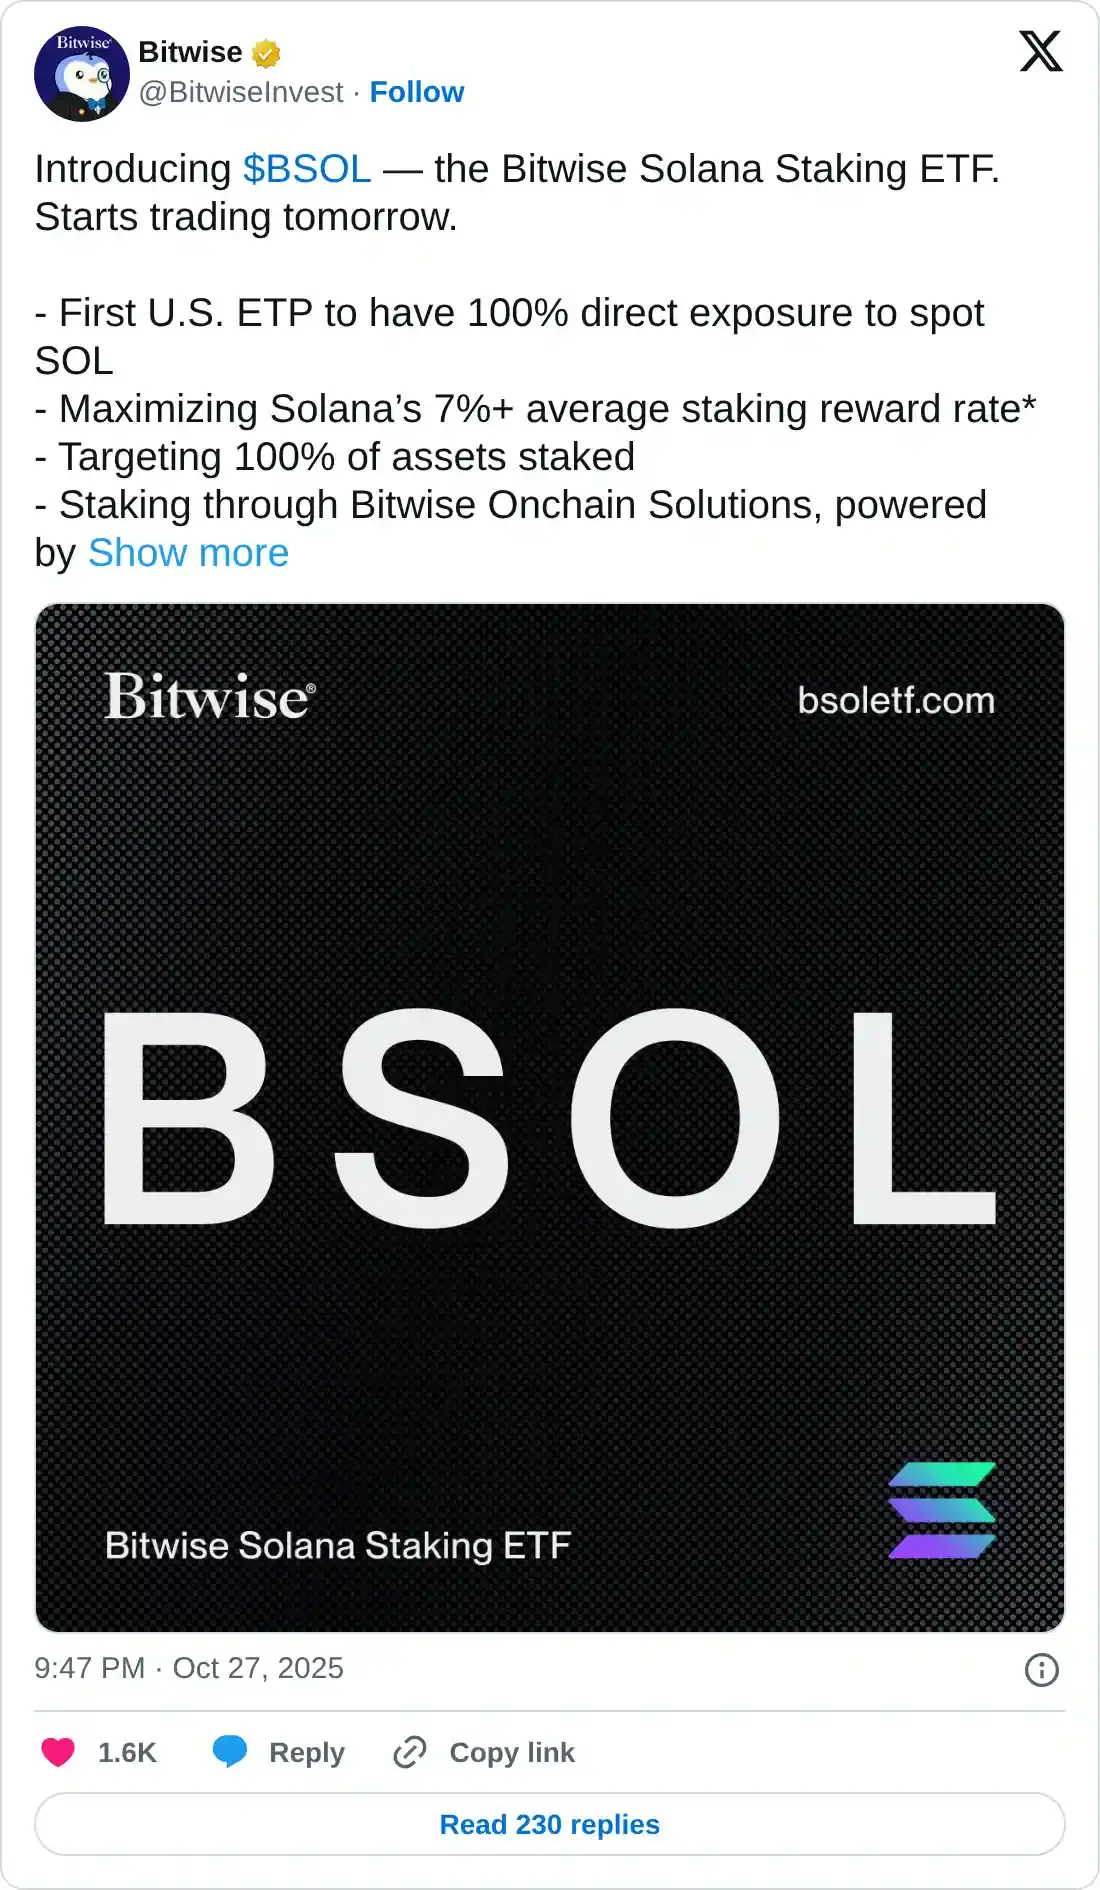
  • The Bitwise Solana Staking ETF will launch on Wednesday, with staking powered by Helius Labs. 
  • Retail demand for Solana remains muted, suggesting a risk-averse sentiment among traders. 

Solana (SOL) price edges higher by over 1% at press time on Tuesday, recovering on the announcement of Bitwise Solana Staking Exchange Traded Fund (ETF)  launching on Wednesday. The technical outlook for Solana indicates multiple overhead resistances that could flip the short-term recovery, given the lack of retail support.  

Solana staking ETF to be launched amid US government shutdown, interest remains low

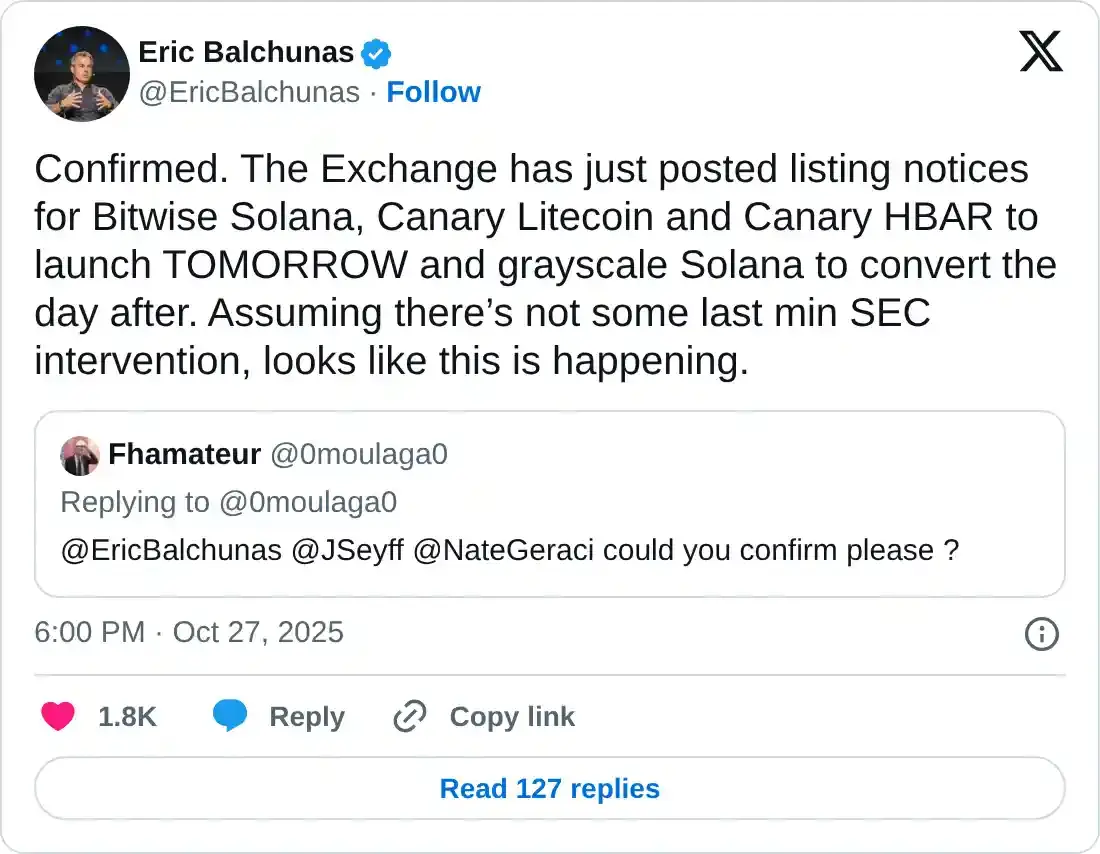
Eric Balchunas, Bloomberg ETF analyst, shared the launch of the Bitwise Solana Staking ETF (BSOL) on Tuesday, followed by the Grayscale Solana Trust (GSOL) converting into an ETF on Wednesday.

https://x.com/EricBalchunas/status/1982870156696281334

The Bitwise SOL staking ETF will capitalize on Solana’s average staking reward rate of 7%, while providing a fee waiver for a limited time. On the other hand, Grayscale holds over $105 million in Solana, which will be converted into an ETF. 

https://x.com/BitwiseInvest/status/1982927182901993968

Despite the announcement, the retail interest in Solana remains muted, underpinned by the broader market volatility. CoinGlass data shows that the Solana futures Open Interest (OI) is at $9.75 billion, up from $9.71 billion on Monday, and has remained largely flat below $10 billion since the October 10 correction. A stagnancy in futures OI indicates that traders are risk-averse, opting for a wait-and-see approach. 

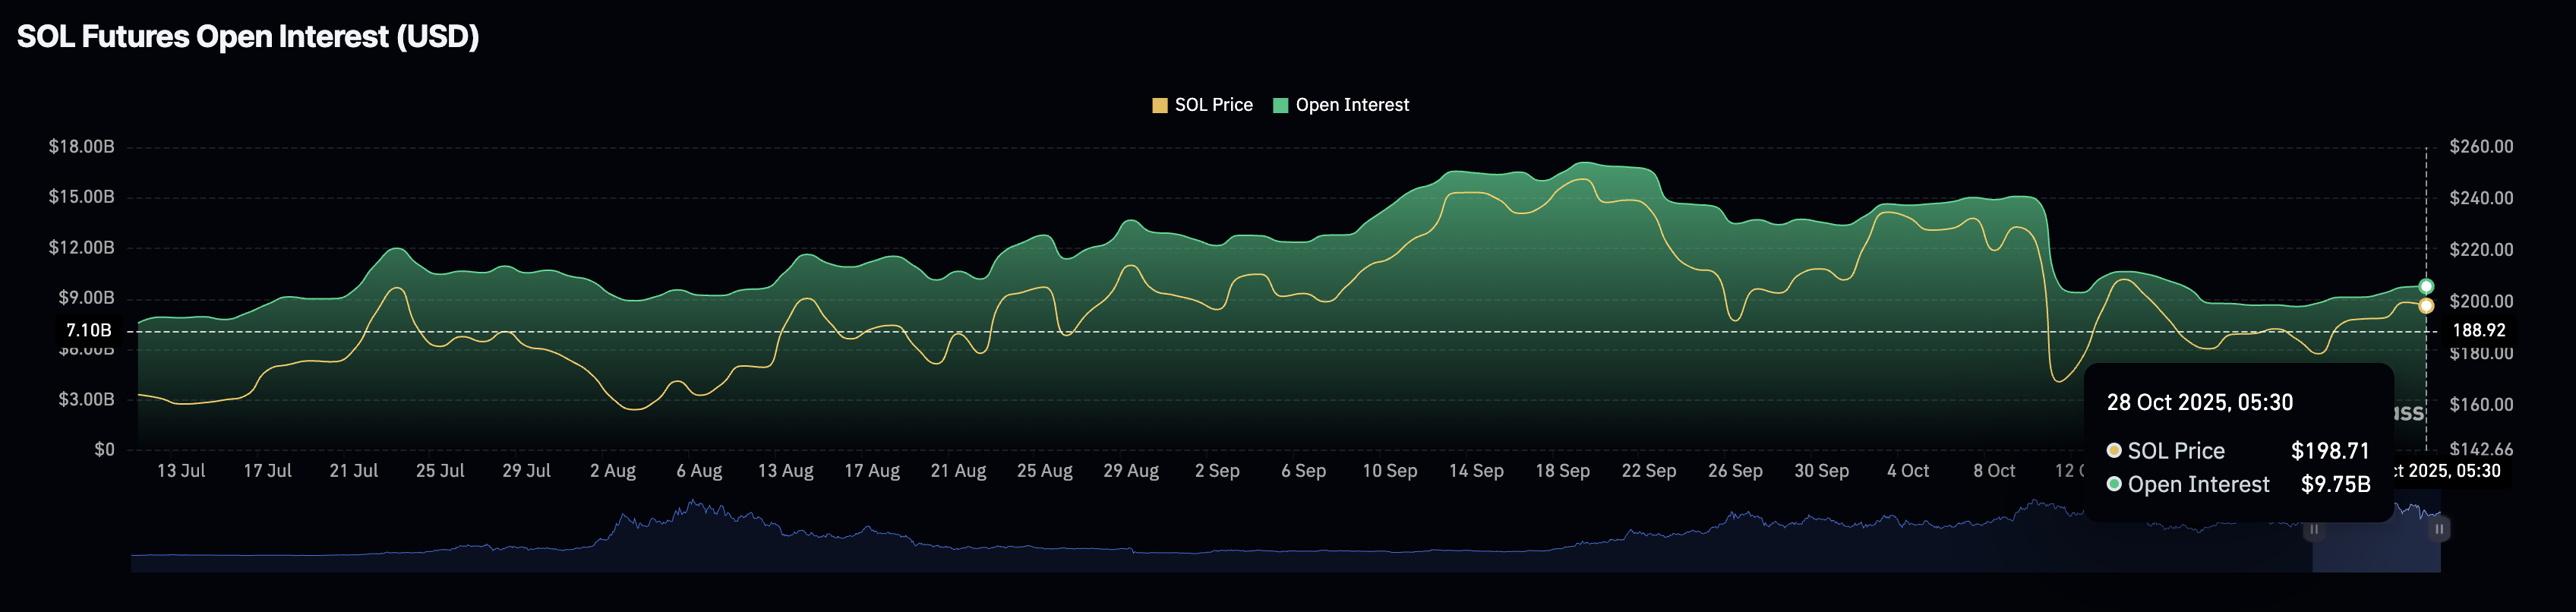
Solana futures Open Interest. Source: CoinGlass

Technical outlook: Will Solana extend its recovery above $200?

Solana trades above the $200 psychological level and the 200-period Exponential Moving Average on the 4-hour price chart. At the time of writing, SOL approaches a crucial supply zone spanning from $204 to $208. 

A decisive close above this zone could encounter resistance at the $237 and $253 levels, marked by the October 6 and September 18 peaks.  

However, as Solana’s recovery stalls near the $204-$208 supply zone, the technical indicators on the 4-hour chart suggest an underlying shift in momentum. The Moving Average Convergence Divergence (MACD) risks crossing below the signal line, which would signal a bearish turn in momentum. 

Still, the Relative Strength Index (RSI) at 62 holds steady between the overbought boundary and the halfway line, suggesting that buying pressure remains strong. 

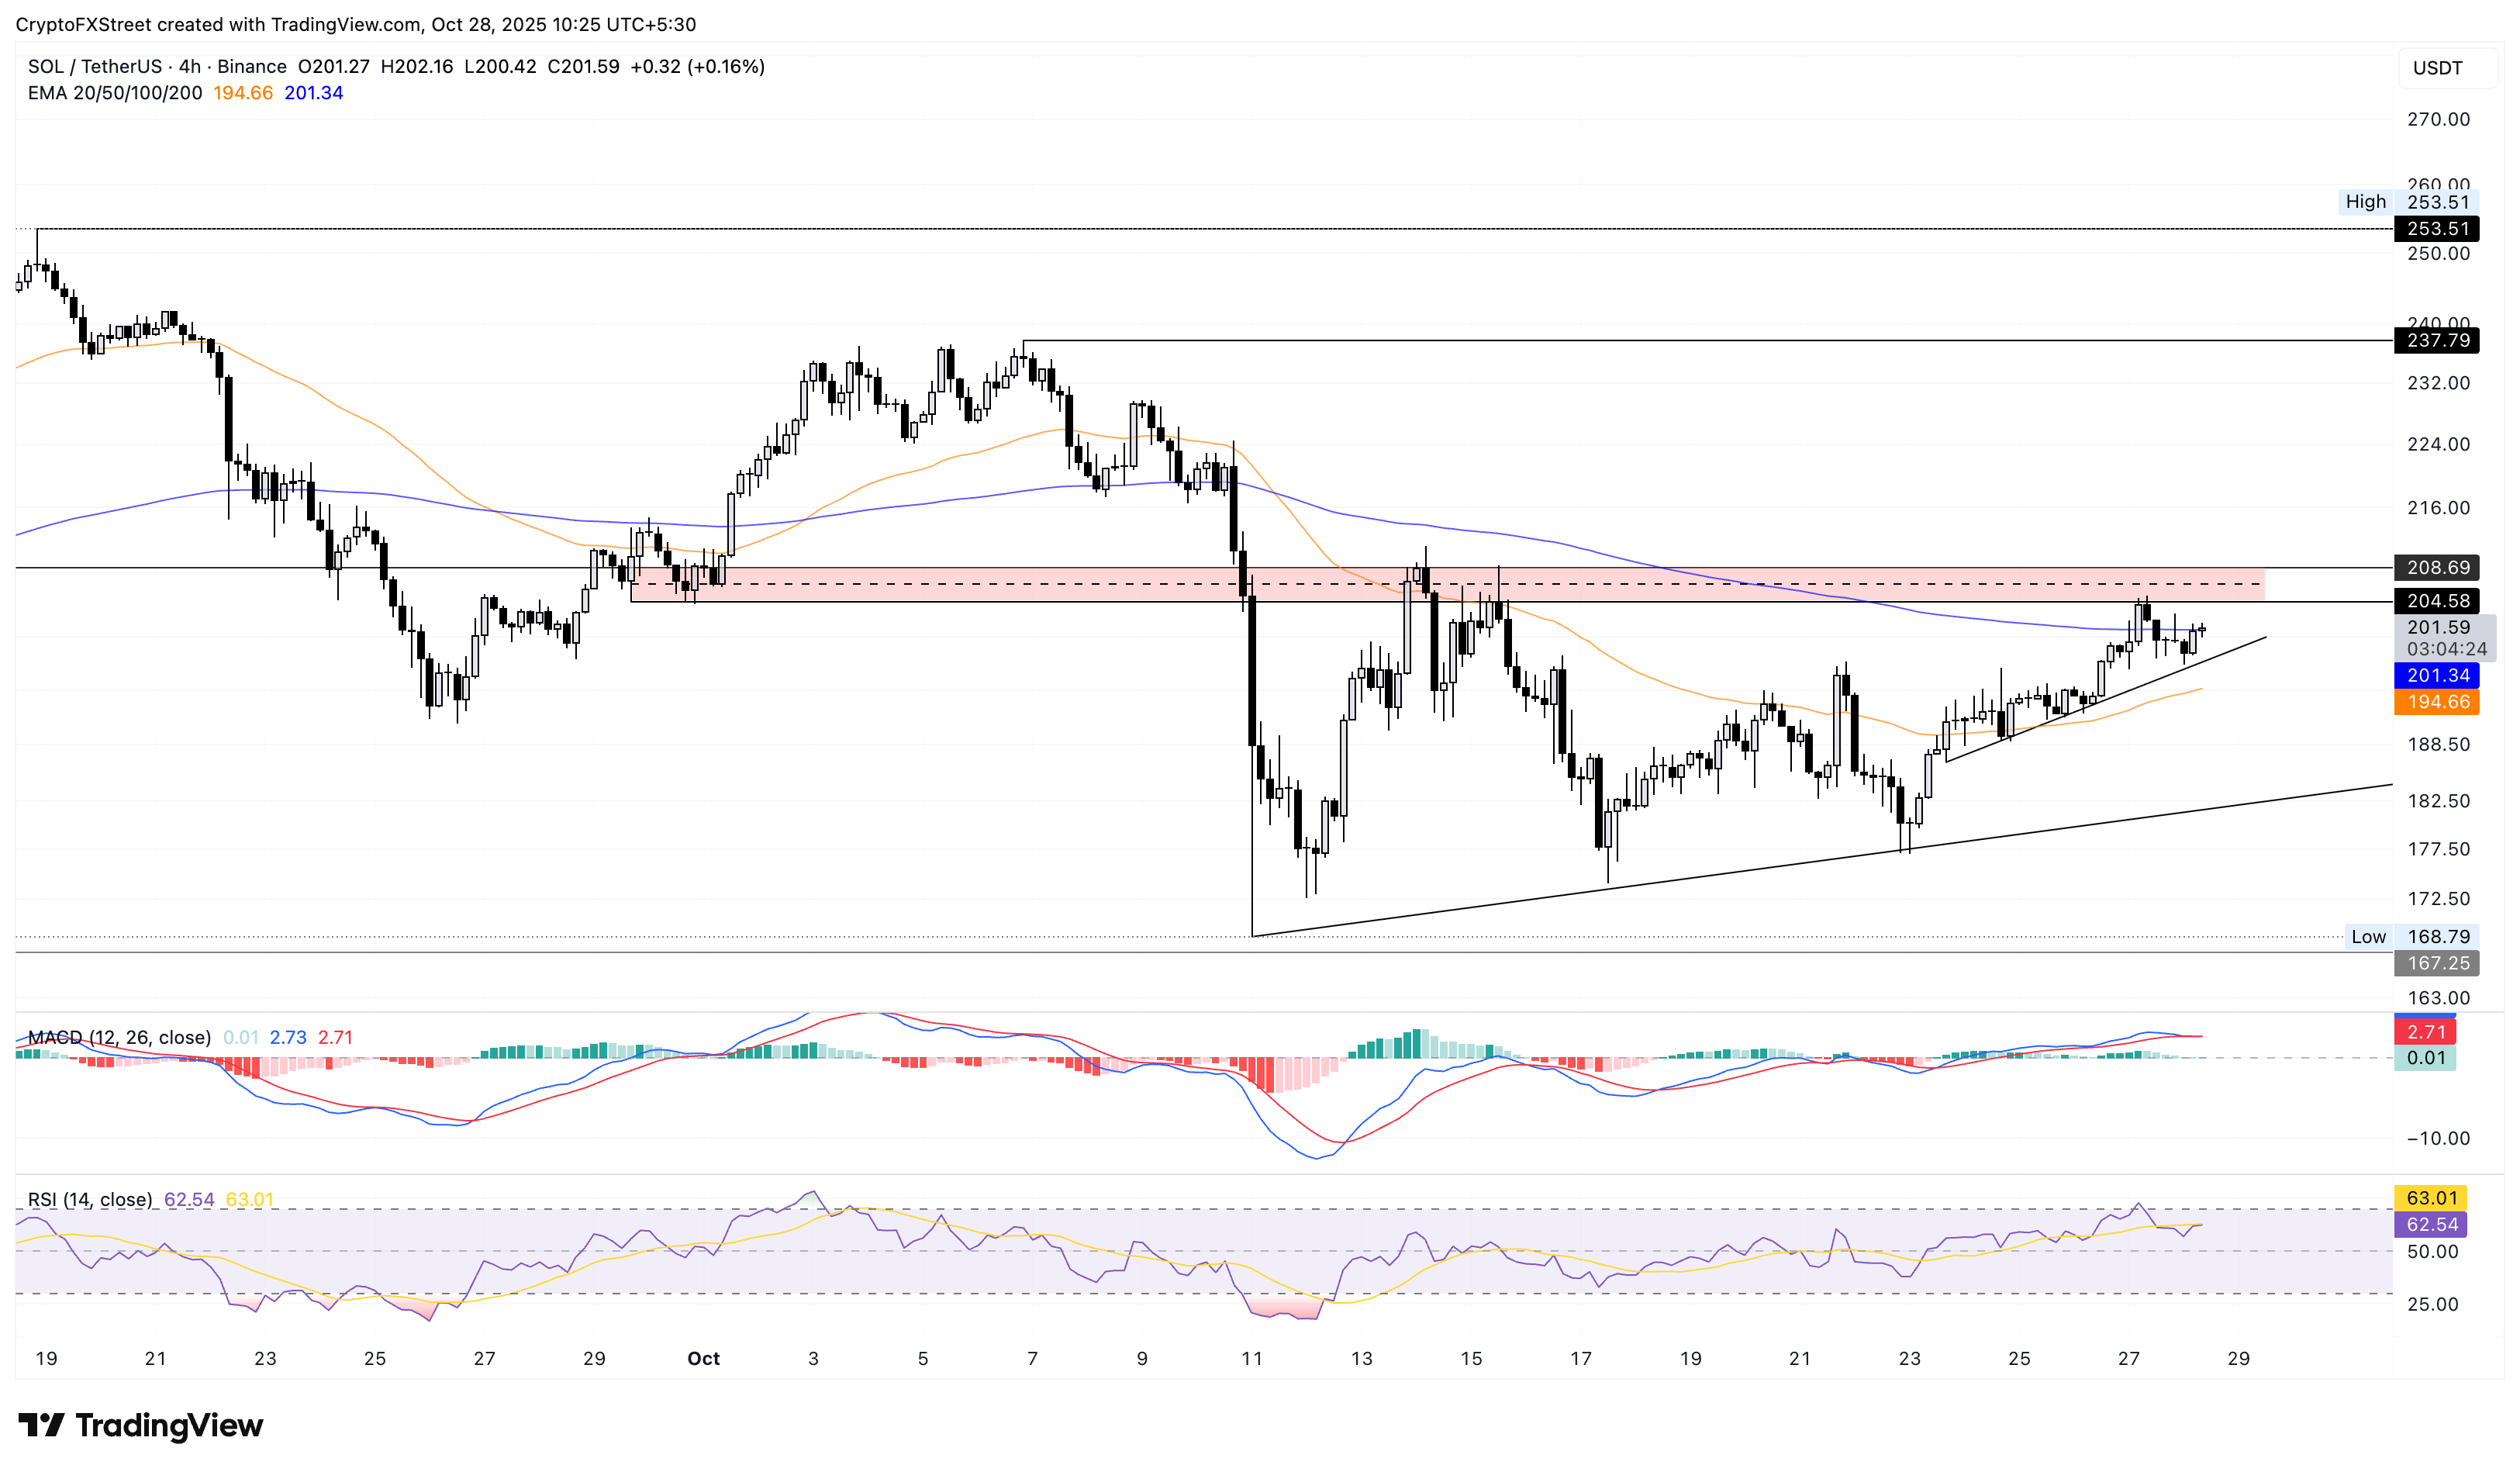
SOL/USDT daily price chart.

If Solana flips to the downside from $204, the key support levels below the 200-period EMA at $201 are the 50-period EMA at $194, followed by a support trendline formed by connecting the October 11 and October 23 lows, near $182. 

ข้อจำกัดความรับผิดชอบ: เพื่อการอ้างอิงเท่านั้น ผลการดำเนินงานในอดีตไม่ได้บ่งบอกถึงผลลัพธ์ในอนาคต
placeholder
หุ้นฟิวเจอร์สสหรัฐขยับขึ้นเล็กน้อย จับตาข้อมูลตลาดแรงงานหุ้นฟิวเจอร์สสหรัฐเปิดตลาดเพิ่มขึ้นเล็กน้อย โดย S&P 500 ฟิวเจอร์ส ขยับขึ้น 0.1% ขณะที่ Nasdaq 100 ฟิวเจอร์ส เพิ่มขึ้น 0.3%ดัชนียังคง ดาวโจนส์ ทรงตัวและ ดัชนีดอลลาร์สหรัฐ ก็ยังคงไม่เปลี่ยนแปลงเช่นกัน ใ
ผู้เขียน  Investing.com
วันที่ 03 ก.ย. 2024
หุ้นฟิวเจอร์สสหรัฐเปิดตลาดเพิ่มขึ้นเล็กน้อย โดย S&P 500 ฟิวเจอร์ส ขยับขึ้น 0.1% ขณะที่ Nasdaq 100 ฟิวเจอร์ส เพิ่มขึ้น 0.3%ดัชนียังคง ดาวโจนส์ ทรงตัวและ ดัชนีดอลลาร์สหรัฐ ก็ยังคงไม่เปลี่ยนแปลงเช่นกัน ใ
placeholder
USD/JPY มีความแข็งแกร่งเหนือ 153.00 จากความเป็นไปได้ของข้อตกลงการค้าสหรัฐ-จีนในช่วงเช้าของตลาดลงทุนเอเชียวันจันทร์ คู่ USDJPY ขยับขึ้นไปที่ประมาณ 153.15 เงินเยนญี่ปุ่น (JPY) อ่อนค่าลงเมื่อเทียบกับดอลลาร์สหรัฐ (USD) ท่ามกลางความเชื่อมั่นของตลาดที่ดีขึ้น เนื่องจากสหรัฐฯ และจีนได้ตกลงเกี่ยวกับกรอบการทำข้อตกลงการค้าในอนาคต
ผู้เขียน  FXStreet
เมื่อวาน 01: 51
ในช่วงเช้าของตลาดลงทุนเอเชียวันจันทร์ คู่ USDJPY ขยับขึ้นไปที่ประมาณ 153.15 เงินเยนญี่ปุ่น (JPY) อ่อนค่าลงเมื่อเทียบกับดอลลาร์สหรัฐ (USD) ท่ามกลางความเชื่อมั่นของตลาดที่ดีขึ้น เนื่องจากสหรัฐฯ และจีนได้ตกลงเกี่ยวกับกรอบการทำข้อตกลงการค้าในอนาคต
placeholder
ทองคำปรับตัวลดลงจากความหวังในการค้าระหว่างสหรัฐฯ-จีน; การเก็งกำไรการลดอัตราดอกเบี้ยของเฟดอาจช่วยจำกัดการขาดทุนทองคํา (XAU/USD) เริ่มต้นสัปดาห์ใหม่ด้วยแนวโน้มที่อ่อนแอกว่า แม้จะขาดแรงขายที่เข้มแข็งและสามารถรักษาระดับเหนือจุดต่ำสุดในวันศุกร์ได้ตลอดช่วงเซสชันเอเชีย สัญญาณการผ่อนคลายความตึงเครียดทางการค้าระหว่างสหรัฐฯ และจีนได้กระตุ้นความต้องการของนักลงทุนสำหรับสินทรัพย์ที่มีความเสี่ยงมากขึ้น
ผู้เขียน  FXStreet
เมื่อวาน 06: 11
ทองคํา (XAU/USD) เริ่มต้นสัปดาห์ใหม่ด้วยแนวโน้มที่อ่อนแอกว่า แม้จะขาดแรงขายที่เข้มแข็งและสามารถรักษาระดับเหนือจุดต่ำสุดในวันศุกร์ได้ตลอดช่วงเซสชันเอเชีย สัญญาณการผ่อนคลายความตึงเครียดทางการค้าระหว่างสหรัฐฯ และจีนได้กระตุ้นความต้องการของนักลงทุนสำหรับสินทรัพย์ที่มีความเสี่ยงมากขึ้น
placeholder
WTI ปรับตัวสูงขึ้นใกล้ $61.50 ขณะที่สหรัฐฯ และจีนบรรลุข้อตกลงการค้าขั้นต้นWest Texas Intermediate (WTI) ซึ่งเป็นเกณฑ์ราคามาตรฐานของน้ำมันดิบของสหรัฐฯ วิ่งซื้อขายอยู่ที่ประมาณ 61.45 ดอลลาร์ในช่วงเวลาการซื้อขายของเอเชียในวันจันทร์ ราคา WTI ขยับสูงขึ้นเนื่องจากความก้าวหน้าในการเจรจาการค้าระหว่างสหรัฐฯ และจีนช่วยเพิ่มแนวโน้มอุปสงค์น้ำมัน
ผู้เขียน  FXStreet
เมื่อวาน 09: 00
West Texas Intermediate (WTI) ซึ่งเป็นเกณฑ์ราคามาตรฐานของน้ำมันดิบของสหรัฐฯ วิ่งซื้อขายอยู่ที่ประมาณ 61.45 ดอลลาร์ในช่วงเวลาการซื้อขายของเอเชียในวันจันทร์ ราคา WTI ขยับสูงขึ้นเนื่องจากความก้าวหน้าในการเจรจาการค้าระหว่างสหรัฐฯ และจีนช่วยเพิ่มแนวโน้มอุปสงค์น้ำมัน
placeholder
คาดการณ์ XAUUSD: ราคาทองคำดิ่งลงใกล้ $4,000 จากความก้าวหน้าในการค้าระหว่างสหรัฐฯ-จีนในช่วงเช้าของตลาดลงทุนเอเชียวันอังคาร ราคาทองคํา (XAUUSD) ร่วงลงสู่ระดับต่ำสุดในรอบสองสัปดาห์ที่ใกล้ $4,000 โลหะมีค่าได้รับแรงกดดันจากการที่สหรัฐฯ และจีนตกลงกันเกี่ยวกับกรอบการทำข้อตกลงการค้า
ผู้เขียน  FXStreet
5 ชั่วโมงที่แล้ว
ในช่วงเช้าของตลาดลงทุนเอเชียวันอังคาร ราคาทองคํา (XAUUSD) ร่วงลงสู่ระดับต่ำสุดในรอบสองสัปดาห์ที่ใกล้ $4,000 โลหะมีค่าได้รับแรงกดดันจากการที่สหรัฐฯ และจีนตกลงกันเกี่ยวกับกรอบการทำข้อตกลงการค้า
ตราสารที่เกี่ยวข้อง
goTop
quote