

Dow Jones Industrial Average pares losses on Friday, but remains steeply bearish
- The Dow Jones recovered around 600 points on Friday.
- Despite the last-minute pullback, the Dow remains down 1,300 points for the week.
- Equities shrugged off one of the worst consumer sentiment prints in years.
The Dow Jones Industrial Average (DJIA) fought back at the brink on Friday, clawing back roughly 500 points following a string of bad losses that saw the Dow Jones crumble 3,373 points, or -7.66%, peak-to-trough over a two-week period. Friday’s broad recovery in equities may be poorly timed, however: University of Michigan (UoM) consumer outlook indicators saw their deepest plunge in years on Friday, and the pain from souring consumer sentiment may hit further down the line.
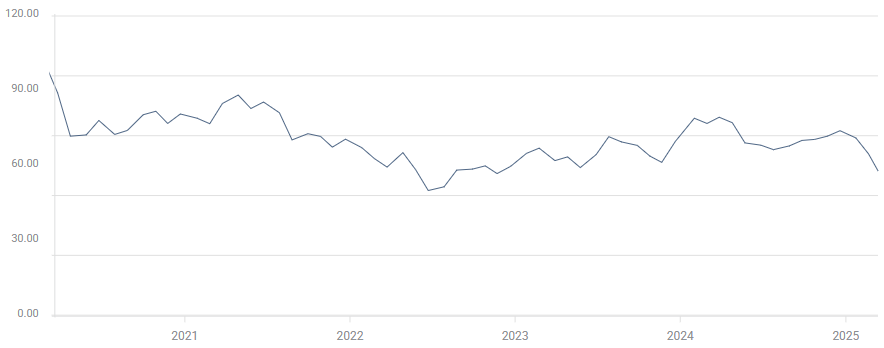
The UoM Consumer Sentiment Index for March tumbled to its lowest print in over two years, slumping to 57.9 as the Trump administration’s aspirations of a global trade war with everyone at the same time begins to punch holes in US consumers’ outlook. Median market forecasts had expected a slight downturn in the key consumer index, expecting a decline to 63.1 from 64.7.
UoM Consumer Sentiment Index (March)
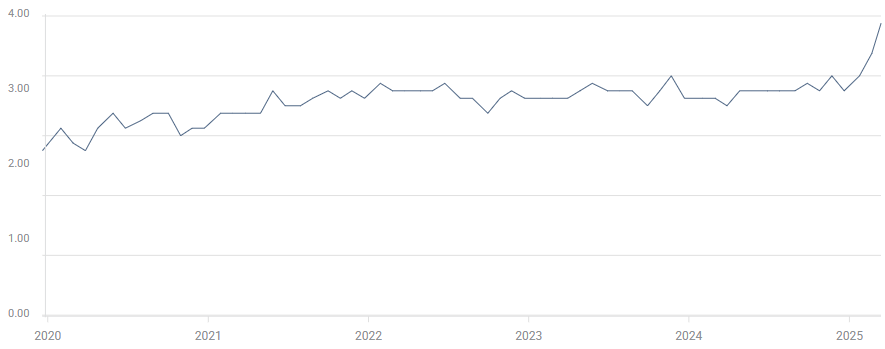
March’s UoM consumer inflation outlook also rocketed to its highest level on record, with the 5-year estimate reaching a multi-decade high of 3.9%, and the indicator’s highest monthly gain in over three decades. UoM one-year inflation expectations also rocketed to a two-year high of 4.9%, anchoring consumer inflation fears well above the Federal Reserve’s (Fed) 2% annual target.
UoM 5-year Consumer Inflation Expectation (March)
Crumbling consumer confidence bodes poorly for economic activity in the US, as noted by chief economist for Comerica Bank Bill Adams:
"The pullback in confidence is becoming a real threat to consumer spending which, as is often repeated, accounts for two thirds of U.S. economic activity."
To their credit, rate markets remain stubbornly attached to the idea of a Q2 rate cut from the Fed. According to the CME’s FedWatch Tool, rate traders are still pricing in nearly 80% odds of another quarter-point rate trim from the Fed in June. Fed Chair Jerome Powell and the other members of the Federal Open Market Committee (FOMC) are expected to stand pat on rates at next week’s rate call and again in May.
Dow Jones news
Most of the securities listed on the Dow Jones Industrial Average are finding room on the high side on Friday as investors stretch their buying buttons. However, gains are concentrated in tech rally favorites and US banking giants. Nvidia (NVDA) has rebounded 4.5%, climbing above $120 per share as the tech rally darling struggles to snap a recent losing streak that dragged the silicon puncher off of record highs above $150.
Read more: JPMorgan, Goldman Sachs, American Express gain on US budget bill prospects
Dow Jones price forecast
A Friday splurge has snapped a four-day losing streak on the Dow Jones, but the major equity index remains on the bearish side of the 200-day Exponential Moving Average (EMA) near the 42,000 major price handle. The Dow Jones came within inches of hitting correction territory after failing to chalk in new highs since November’s peak just north of 45,000, and stock traders will be looking to extend a fresh bullish leg after briefly testing chart territory below 41,000.
Dow Jones daily chart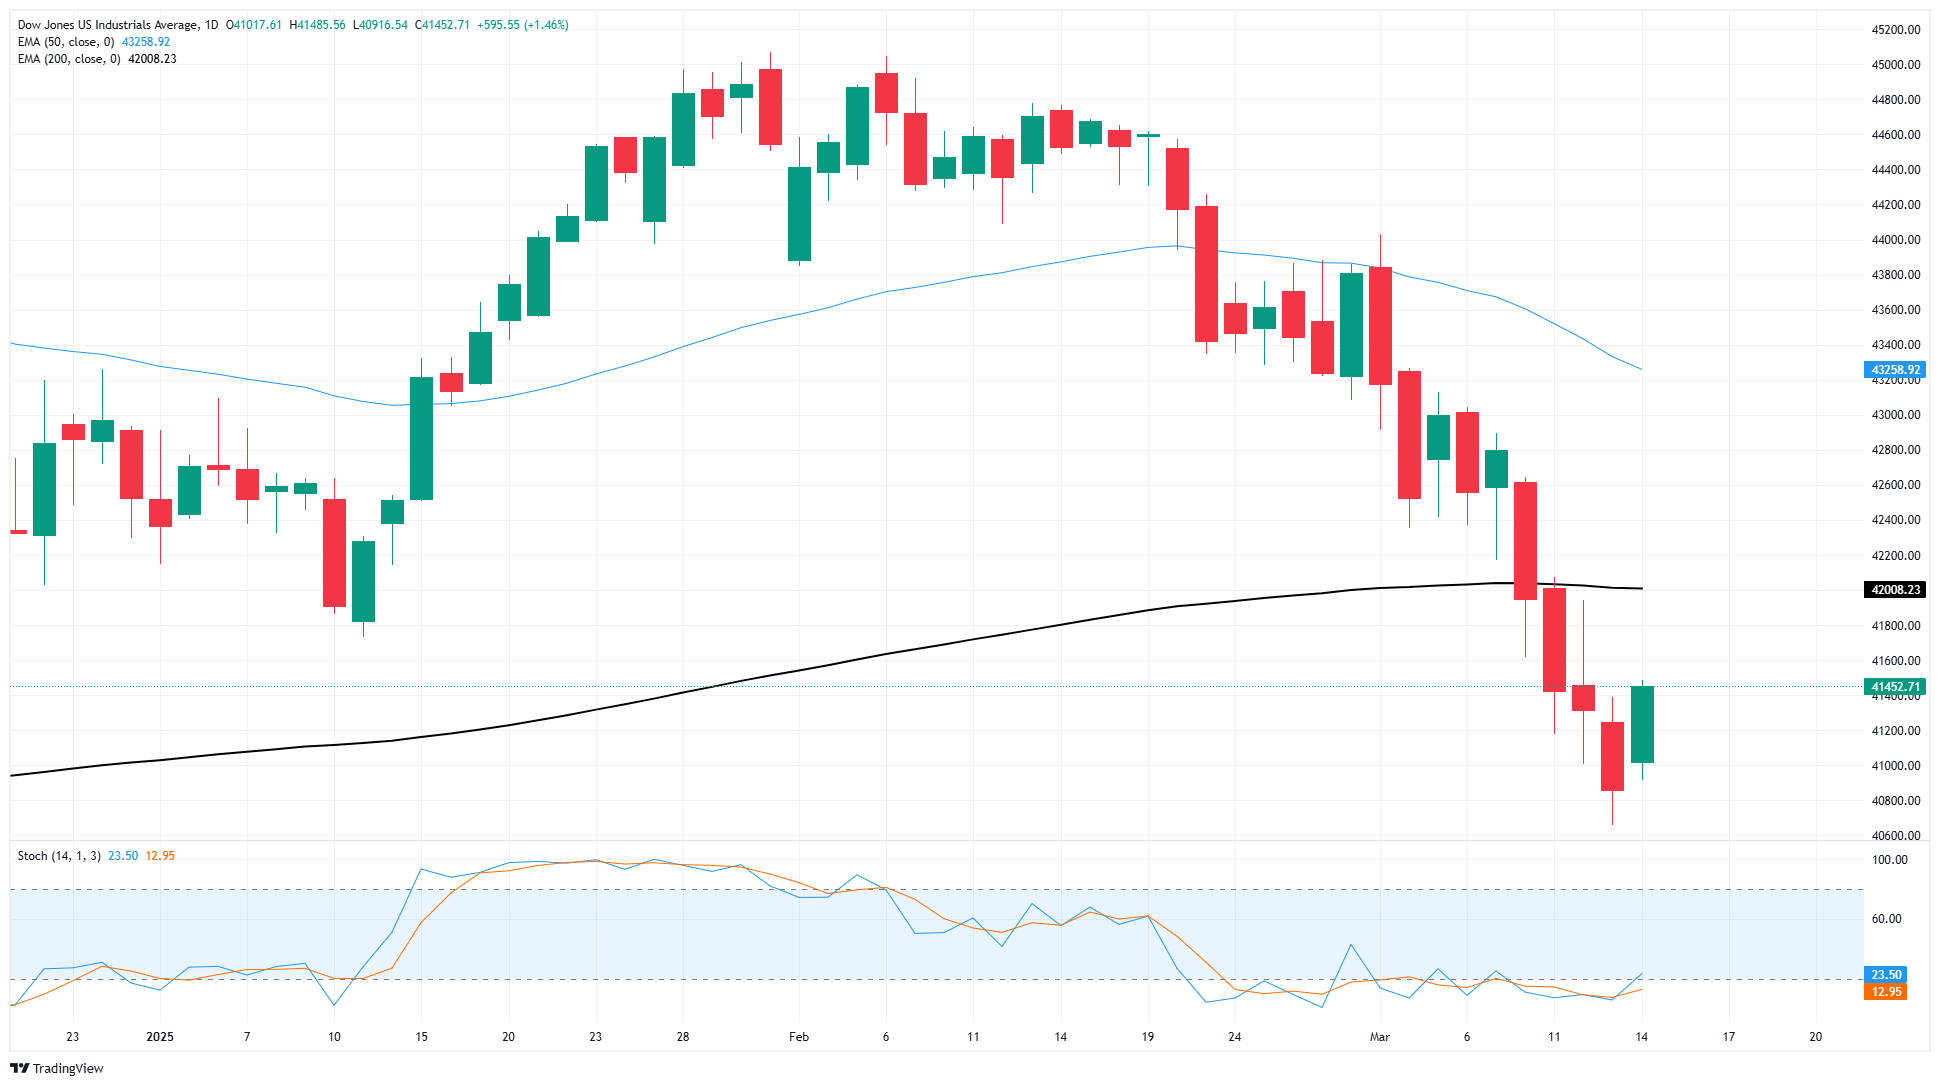
Dow Jones FAQs
The Dow Jones Industrial Average, one of the oldest stock market indices in the world, is compiled of the 30 most traded stocks in the US. The index is price-weighted rather than weighted by capitalization. It is calculated by summing the prices of the constituent stocks and dividing them by a factor, currently 0.152. The index was founded by Charles Dow, who also founded the Wall Street Journal. In later years it has been criticized for not being broadly representative enough because it only tracks 30 conglomerates, unlike broader indices such as the S&P 500.
Many different factors drive the Dow Jones Industrial Average (DJIA). The aggregate performance of the component companies revealed in quarterly company earnings reports is the main one. US and global macroeconomic data also contributes as it impacts on investor sentiment. The level of interest rates, set by the Federal Reserve (Fed), also influences the DJIA as it affects the cost of credit, on which many corporations are heavily reliant. Therefore, inflation can be a major driver as well as other metrics which impact the Fed decisions.
Dow Theory is a method for identifying the primary trend of the stock market developed by Charles Dow. A key step is to compare the direction of the Dow Jones Industrial Average (DJIA) and the Dow Jones Transportation Average (DJTA) and only follow trends where both are moving in the same direction. Volume is a confirmatory criteria. The theory uses elements of peak and trough analysis. Dow’s theory posits three trend phases: accumulation, when smart money starts buying or selling; public participation, when the wider public joins in; and distribution, when the smart money exits.
There are a number of ways to trade the DJIA. One is to use ETFs which allow investors to trade the DJIA as a single security, rather than having to buy shares in all 30 constituent companies. A leading example is the SPDR Dow Jones Industrial Average ETF (DIA). DJIA futures contracts enable traders to speculate on the future value of the index and Options provide the right, but not the obligation, to buy or sell the index at a predetermined price in the future. Mutual funds enable investors to buy a share of a diversified portfolio of DJIA stocks thus providing exposure to the overall index.
Artigos Recomendados


