

Dow Jones Industrial Average declines further on extended drop in producer inflation
- Dow Jones backslides over 150 points on Thursday.
- Treasury yields and equities backslid after US PPI figures declined.
- US Initial Jobless Claims also rose faster than expected, sparking recession concerns.
The Dow Jones Industrial Average (DJIA) tumbled another 150-plus points on Thursday after US data hinted at a further contraction of the overall economy, briefly sparking risk-off bids into the US Dollar (USD) and forcing Treasury yields lower alongside equity indexes.
US Producer Price Index (PPI) inflation eased faster than expected in May, contracting -0.2% MoM compared to the forecast move lower to 0.1% from 0.5%. Annualized Core PPI also ticked down to 2.3% YoY, falling from the forecast steady print at 2.4%.
US Initial Jobless Claims also rose faster than expected for the week ended June 7, rising to 242K versus the forecast 225K and the previous 229K. Declining producer-level inflation and rising unemployment benefits seekers are exposing cracks in the US economy, reigniting fears of a possible recession looming ahead.
Investor sentiment is on the ropes on Thursday after the Federal Reserve (Fed) held rates on Wednesday and cautioned that the US central bank only expects to make a single rate cut in 2024, down from the three initially forecast in March. Risk-off flows are sapping strength out of equity indexes heading into the tail-end of the trading week, though momentum could flip back to the bullish side. According to the CME’s FedWatch Tool, rate traders are pricing in nearly-even odds of a first quarter-point rate trim in either September or November, with rate markets pricing in a 76% chance of a quarter-point rate cut on September 18.
Dow Jones news
Two-thirds of the Dow Jones index is underwater on Thursday, with losses being led by Salesforce Inc. (CRM) which declined -2.16% to $230.71 per share. On the high side, JPMorgan Chase & Co. (JPM) is recovering from a recent selloff, climbing 0.92% to $193.34 per share.
Dow Jones technical outlook
The Dow Jones is grappling with an intraday recovery from the day’s early lows near 38,393.00, as DJIA bidders try to force action back above the 38,600.00 level. US equities are grinding out a slow recovery from Thursday’s early declines, pulling back into the trading week’s range after setting a brief new low for the week.
The Dow Jones is on pace for a third consecutive down day, but price action continues to hold above a near-term demand zone below the 38,000.00 handle. The index remains down nearly 4% from all-time highs above 40,000.00, but is still decidedly bullish in 2024, up 2.3% from January’s opening bids.
Dow Jones five minute chart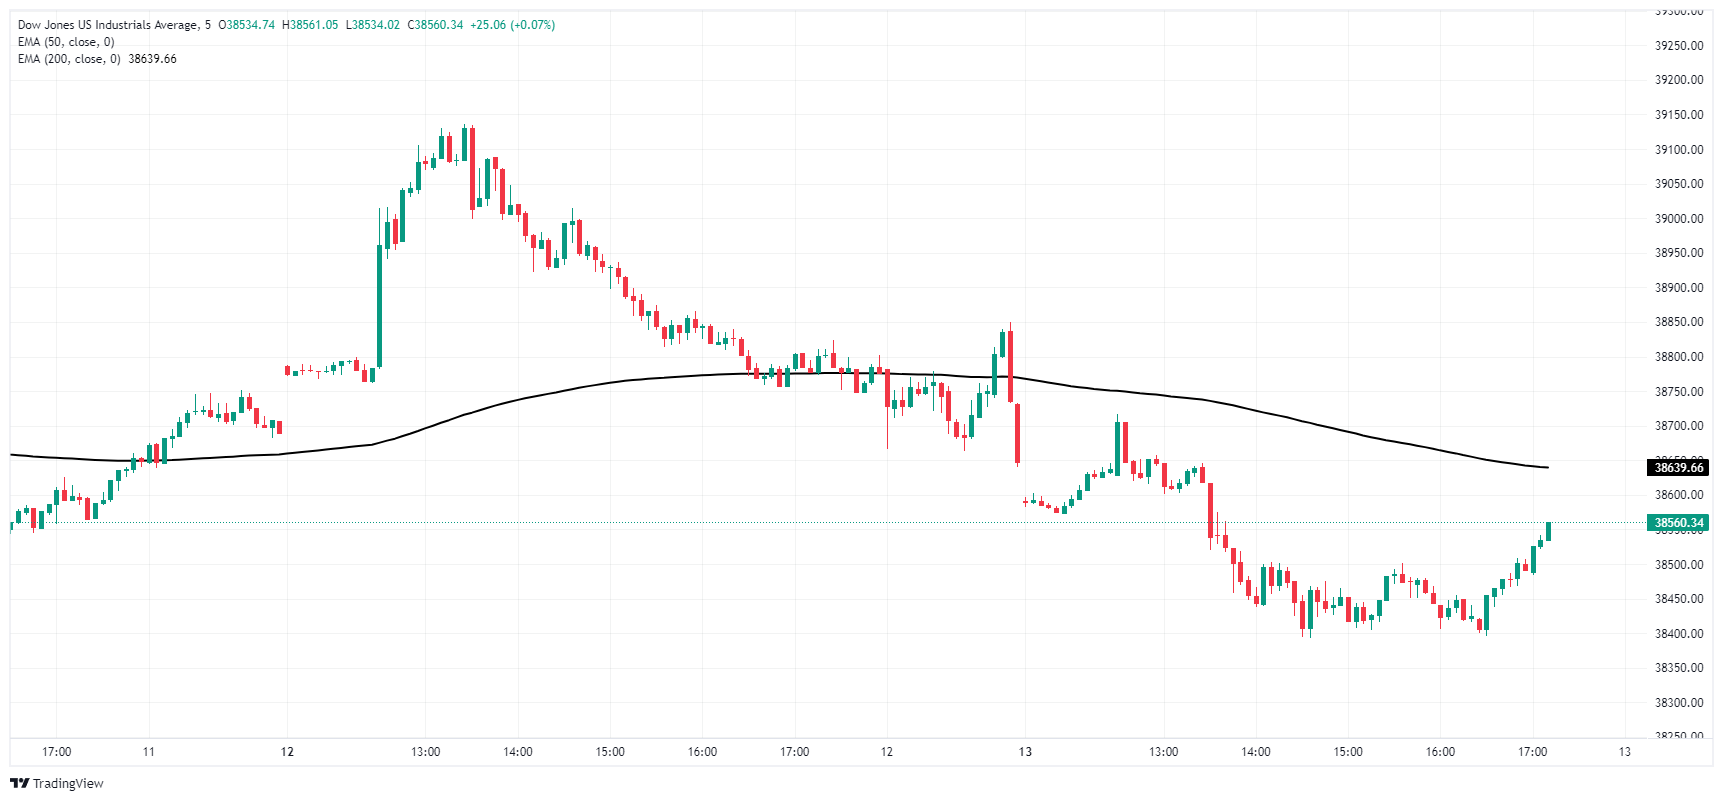
Dow Jones daily chart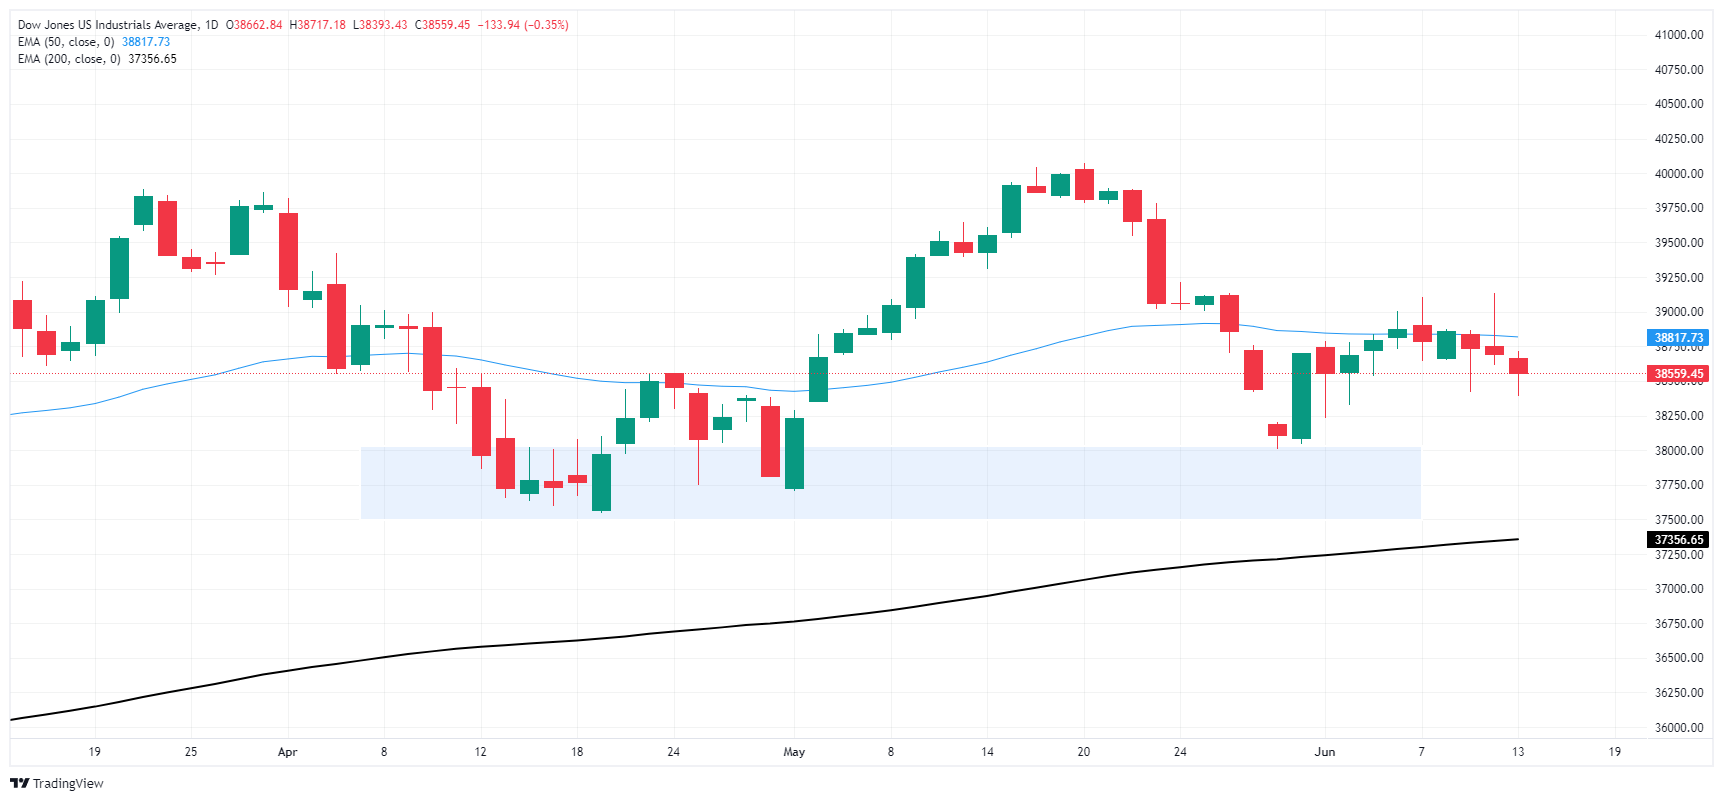
Dow Jones FAQs
The Dow Jones Industrial Average, one of the oldest stock market indices in the world, is compiled of the 30 most traded stocks in the US. The index is price-weighted rather than weighted by capitalization. It is calculated by summing the prices of the constituent stocks and dividing them by a factor, currently 0.152. The index was founded by Charles Dow, who also founded the Wall Street Journal. In later years it has been criticized for not being broadly representative enough because it only tracks 30 conglomerates, unlike broader indices such as the S&P 500.
Many different factors drive the Dow Jones Industrial Average (DJIA). The aggregate performance of the component companies revealed in quarterly company earnings reports is the main one. US and global macroeconomic data also contributes as it impacts on investor sentiment. The level of interest rates, set by the Federal Reserve (Fed), also influences the DJIA as it affects the cost of credit, on which many corporations are heavily reliant. Therefore, inflation can be a major driver as well as other metrics which impact the Fed decisions.
Dow Theory is a method for identifying the primary trend of the stock market developed by Charles Dow. A key step is to compare the direction of the Dow Jones Industrial Average (DJIA) and the Dow Jones Transportation Average (DJTA) and only follow trends where both are moving in the same direction. Volume is a confirmatory criteria. The theory uses elements of peak and trough analysis. Dow’s theory posits three trend phases: accumulation, when smart money starts buying or selling; public participation, when the wider public joins in; and distribution, when the smart money exits.
There are a number of ways to trade the DJIA. One is to use ETFs which allow investors to trade the DJIA as a single security, rather than having to buy shares in all 30 constituent companies. A leading example is the SPDR Dow Jones Industrial Average ETF (DIA). DJIA futures contracts enable traders to speculate on the future value of the index and Options provide the right, but not the obligation, to buy or sell the index at a predetermined price in the future. Mutual funds enable investors to buy a share of a diversified portfolio of DJIA stocks thus providing exposure to the overall index.
Artigos Recomendados


