Uniswap price is poised for a rally if it breaks above the ascending triangle pattern

Fonte Fxstreet
  • Uniswap price is squeezed between the boundaries of an ascending triangle; a breakout signals a bullish move ahead.
  • On-chain data shows a bullish bias as UNI’s Exchange Flow Balance is negative, and the exchange supply decreases.
  • A daily candlestick close below $5.54 would invalidate the bullish thesis.


Uniswap (UNI) price trades inside an ascending triangle pattern; a breakout signals a rally ahead. This bullish move is further supported by UNI’s on-chain data, which shows a negative Exchange Flow Balance and decreasing exchange supply, hinting at a rally ahead.

Uniswap price looks set to resolve ascending triangle to the upside

Uniswap price has produced two higher lows and three roughly equal highs since August 2. Connecting these swing points using a trend line reveals an ascending triangle formation in the daily chart. This technical pattern has a bullish bias, and the target is generally obtained by measuring the distance between the first swing high and the first swing low to the breakout point. At the time of writing on Thursday, it trades 1.75% higher, inside the ascending triangle at $6.86.

Assuming the breakout happens by closing a daily candlestick above the weekly resistance at $7.06, adding the 35% measurement to the potential breakout level of $7.06 reveals a target of $9.38. Investors should be cautious of this theoretical move as it could face a slowdown at Uniswap’s daily resistance level of $8.19 and could book some profits at $8.19. However, since the Relative Strength Index (RSI) and Awesome Oscillator (AO) indicators on the daily chart are firmly above their respective neutral levels of 50 and zero, the possibility of a slowdown above is unlikely.
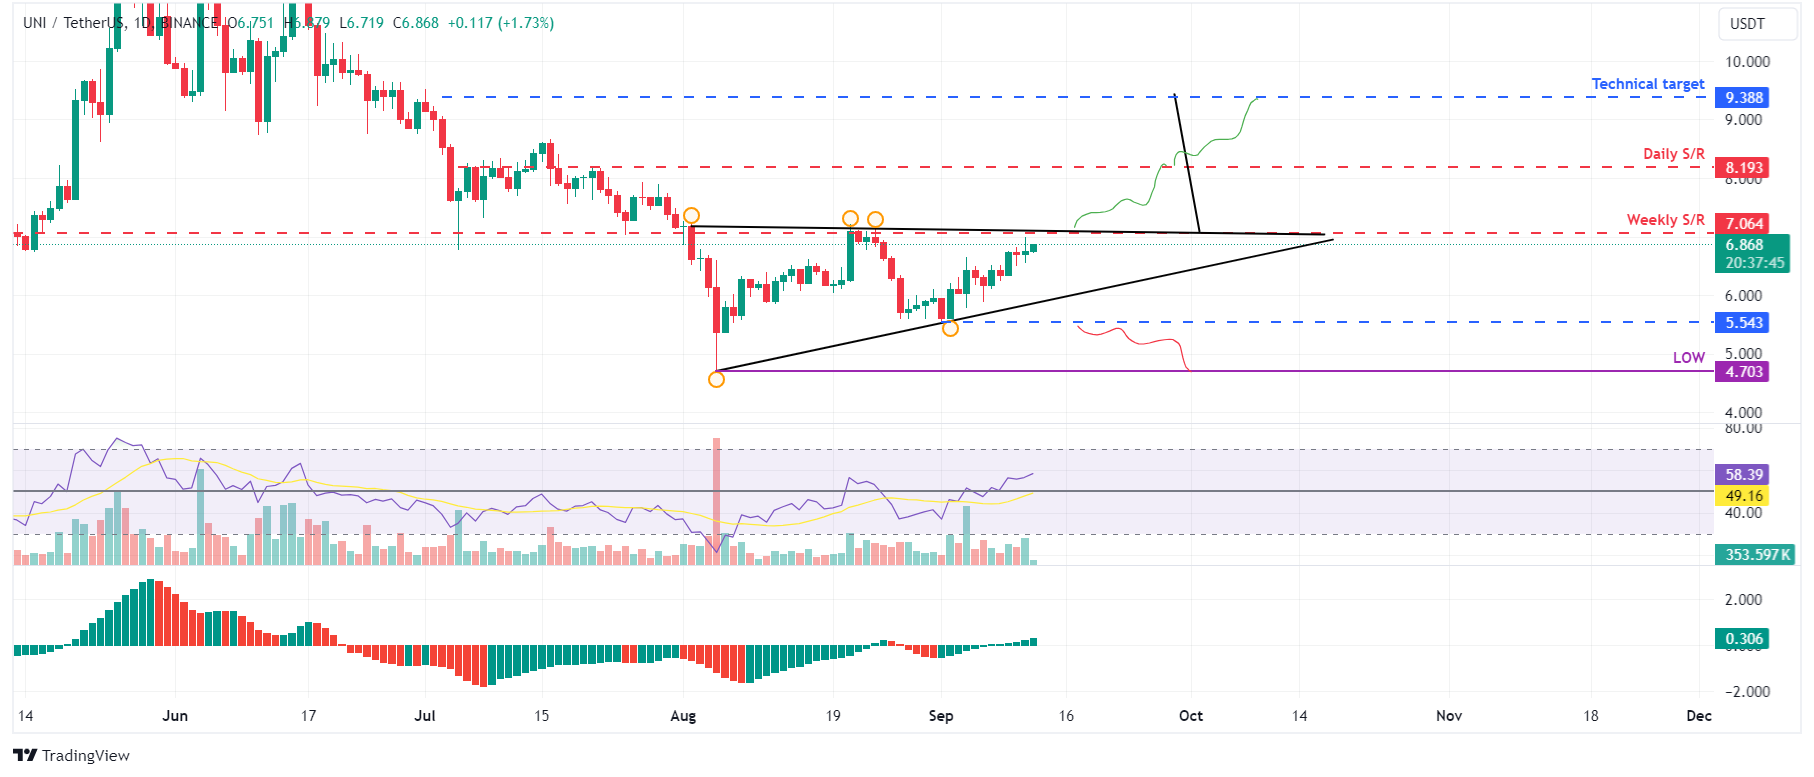
UNI/USDT daily chart

UNI/USDT daily chart

Santiment’s Exchange Flow Balance shows the net movement of Uniswap tokens into and out of exchange wallets. A positive spike indicates more tokens have entered than exited, suggesting selling pressure from investors. Conversely, a negative value indicates more tokens left the exchange than entered, indicating less selling pressure from investors and holders accumulating the asset.

In the case of UNI, this metric slumped from 12,250 to -1.85 million from September 4 to September 5 and from 7,015 to -1.05 million from Sunday to Monday. This negative shift indicates increased buying activity among investors.


During this event, the Uniswap Supply on Exchanges declined by 4.7%. This is a bullish development, as holders remove UNI from exchanges and hold it in cold wallets, further denoting investor confidence in Uniswap.

Uniswap Exchange Flow Balance and Supply on Exchange chart

Uniswap Exchange Flow Balance and Supply on Exchange chart

Despite the bullish thesis signaled by both on-chain data and technical analysis, if UNI breaks the upward trendline of the triangle and closes below $5.54, the outlook would shift to bearish. This scenario could lead to a crash of 16% to $4.70, a daily low of August 5.

Isenção de responsabilidade: Apenas para fins informativos. O desempenho passado não é indicativo de resultados futuros.
placeholder
Os otimistas do ouro ainda não estão dispostos a desistir, em meio às apostas na redução das taxas de juros pelo Fed e aos riscos geopolíticosO ouro (XAU/USD) inicia a nova semana em baixa, embora consiga reverter uma queda na sessão asiática para a área de US$ 3.627-3.626 e atualmente seja negociado perto do limite superior de uma faixa de negociação com uma semana de duração.
Autor  FXStreet
16 horas atrás
O ouro (XAU/USD) inicia a nova semana em baixa, embora consiga reverter uma queda na sessão asiática para a área de US$ 3.627-3.626 e atualmente seja negociado perto do limite superior de uma faixa de negociação com uma semana de duração.
placeholder
Previsão dos 3 principais preços: Bitcoin, Ethereum, Ripple – BTC se estabiliza, ETH encontra suporte, XRP rompe padrão de altaBitcoin (BTC), Ethereum (ETH) e Ripple (XRP) oscilam em torno de níveis importantes após recuperarem quase 4%, 7% e 6%, respectivamente, na semana passada.
Autor  FXStreet
16 horas atrás
Bitcoin (BTC), Ethereum (ETH) e Ripple (XRP) oscilam em torno de níveis importantes após recuperarem quase 4%, 7% e 6%, respectivamente, na semana passada.
placeholder
Previsão do preço da Solana: SOL visa máximos históricos, com a demanda institucional e as métricas on-chain sustentando a altaO preço da Solana (SOL) está sendo negociado em alta, acima de US$ 242 no momento da redação desta matéria na segunda-feira, após romper um canal paralelo na semana passada, com os otimistas buscando recordes históricos.
Autor  FXStreet
16 horas atrás
O preço da Solana (SOL) está sendo negociado em alta, acima de US$ 242 no momento da redação desta matéria na segunda-feira, após romper um canal paralelo na semana passada, com os otimistas buscando recordes históricos.
placeholder
KNCA11 lucra R$ 20,6 milhões e anuncia novo CRA; TRXF11 compra ativo do Mercado Livre por R$ 207 milhõesO Fiagro Kinea Crédito Agro (KNCA11) divulgou seu relatório gerencial referente ao mês de agosto de 2025, informando um resultado líquido de R$ 20,6 milhões. O valor representa uma queda em relação ao montante de R$ 31,7 milhões que havia sido apurado em julho. Apesar da redução no lucro, o fundo manteve sua política de distribuição de dividendos, anunciando o pagamento de R$ 1,00 por cota aos seus investidores.
Autor  Pedro Augusto Prazeres
20 horas atrás
O Fiagro Kinea Crédito Agro (KNCA11) divulgou seu relatório gerencial referente ao mês de agosto de 2025, informando um resultado líquido de R$ 20,6 milhões. O valor representa uma queda em relação ao montante de R$ 31,7 milhões que havia sido apurado em julho. Apesar da redução no lucro, o fundo manteve sua política de distribuição de dividendos, anunciando o pagamento de R$ 1,00 por cota aos seus investidores.
placeholder
Dólar cai para R$ 5,35, menor valor em 15 meses; mercado monitora decisões de juros e tensões com EUAO dólar completou a terceira sessão consecutiva de queda no mercado de câmbio brasileiro e encerrou a sexta-feira (12) cotado a R$ 5,3464, seu menor valor de fechamento em 15 meses, desde junho de 2024. O movimento de valorização do real ocorreu a despeito de um dia de ganhos para a moeda norte-americana no cenário internacional, mostrando a força de fatores locais e da expectativa em relação à política monetária dos dois países.
Autor  Pedro Augusto Prazeres
20 horas atrás
O dólar completou a terceira sessão consecutiva de queda no mercado de câmbio brasileiro e encerrou a sexta-feira (12) cotado a R$ 5,3464, seu menor valor de fechamento em 15 meses, desde junho de 2024. O movimento de valorização do real ocorreu a despeito de um dia de ganhos para a moeda norte-americana no cenário internacional, mostrando a força de fatores locais e da expectativa em relação à política monetária dos dois países.
Produtos relacionados
goTop
quote