
Top Crypto Gainers: MYX Finance, Plasma rebound while Mantle, PancakeSwap rally
- MYX Finance and Plasma post double-digit gains in the last 24 hours, outpacing the broader cryptocurrency market.
- Mantle’s wedge breakout rally takes a breather on Tuesday after reaching a new all-time high.
- PancakeSwap holds steady after a 16% gain on Monday, extending the ascending triangle breakout rally.
MYX Finance (MYX) and Plasma (XPL) record double-digit gains in the last 24 hours, spearheading the broader cryptocurrency market. In the same period, Mantle (MNT) and PancakeSwap (CAKE) extend their rally with a bullish technical outlook as momentum increases.
MYX Finance could be in a dead cat bounce
MYX Finance ticks higher by 7% at press time on Tuesday, extending the 27% rise from the previous day. The second consecutive day of recovery in MYX targets the overhead 50-day Exponential Moving Average (EMA) at $7.98.
A decisive push above this level could extend the recovery run above $10, targeting the $10.53 level marked by the September 15 close.
The technical indicators on the same chart suggest overhead pressure as the Relative Strength Index (RSI) at 42 hovers below the halfway line. Additionally, the Moving Average Convergence Divergence (MACD) maintains a declining trend, with its signal line indicating a dominant bearish momentum.
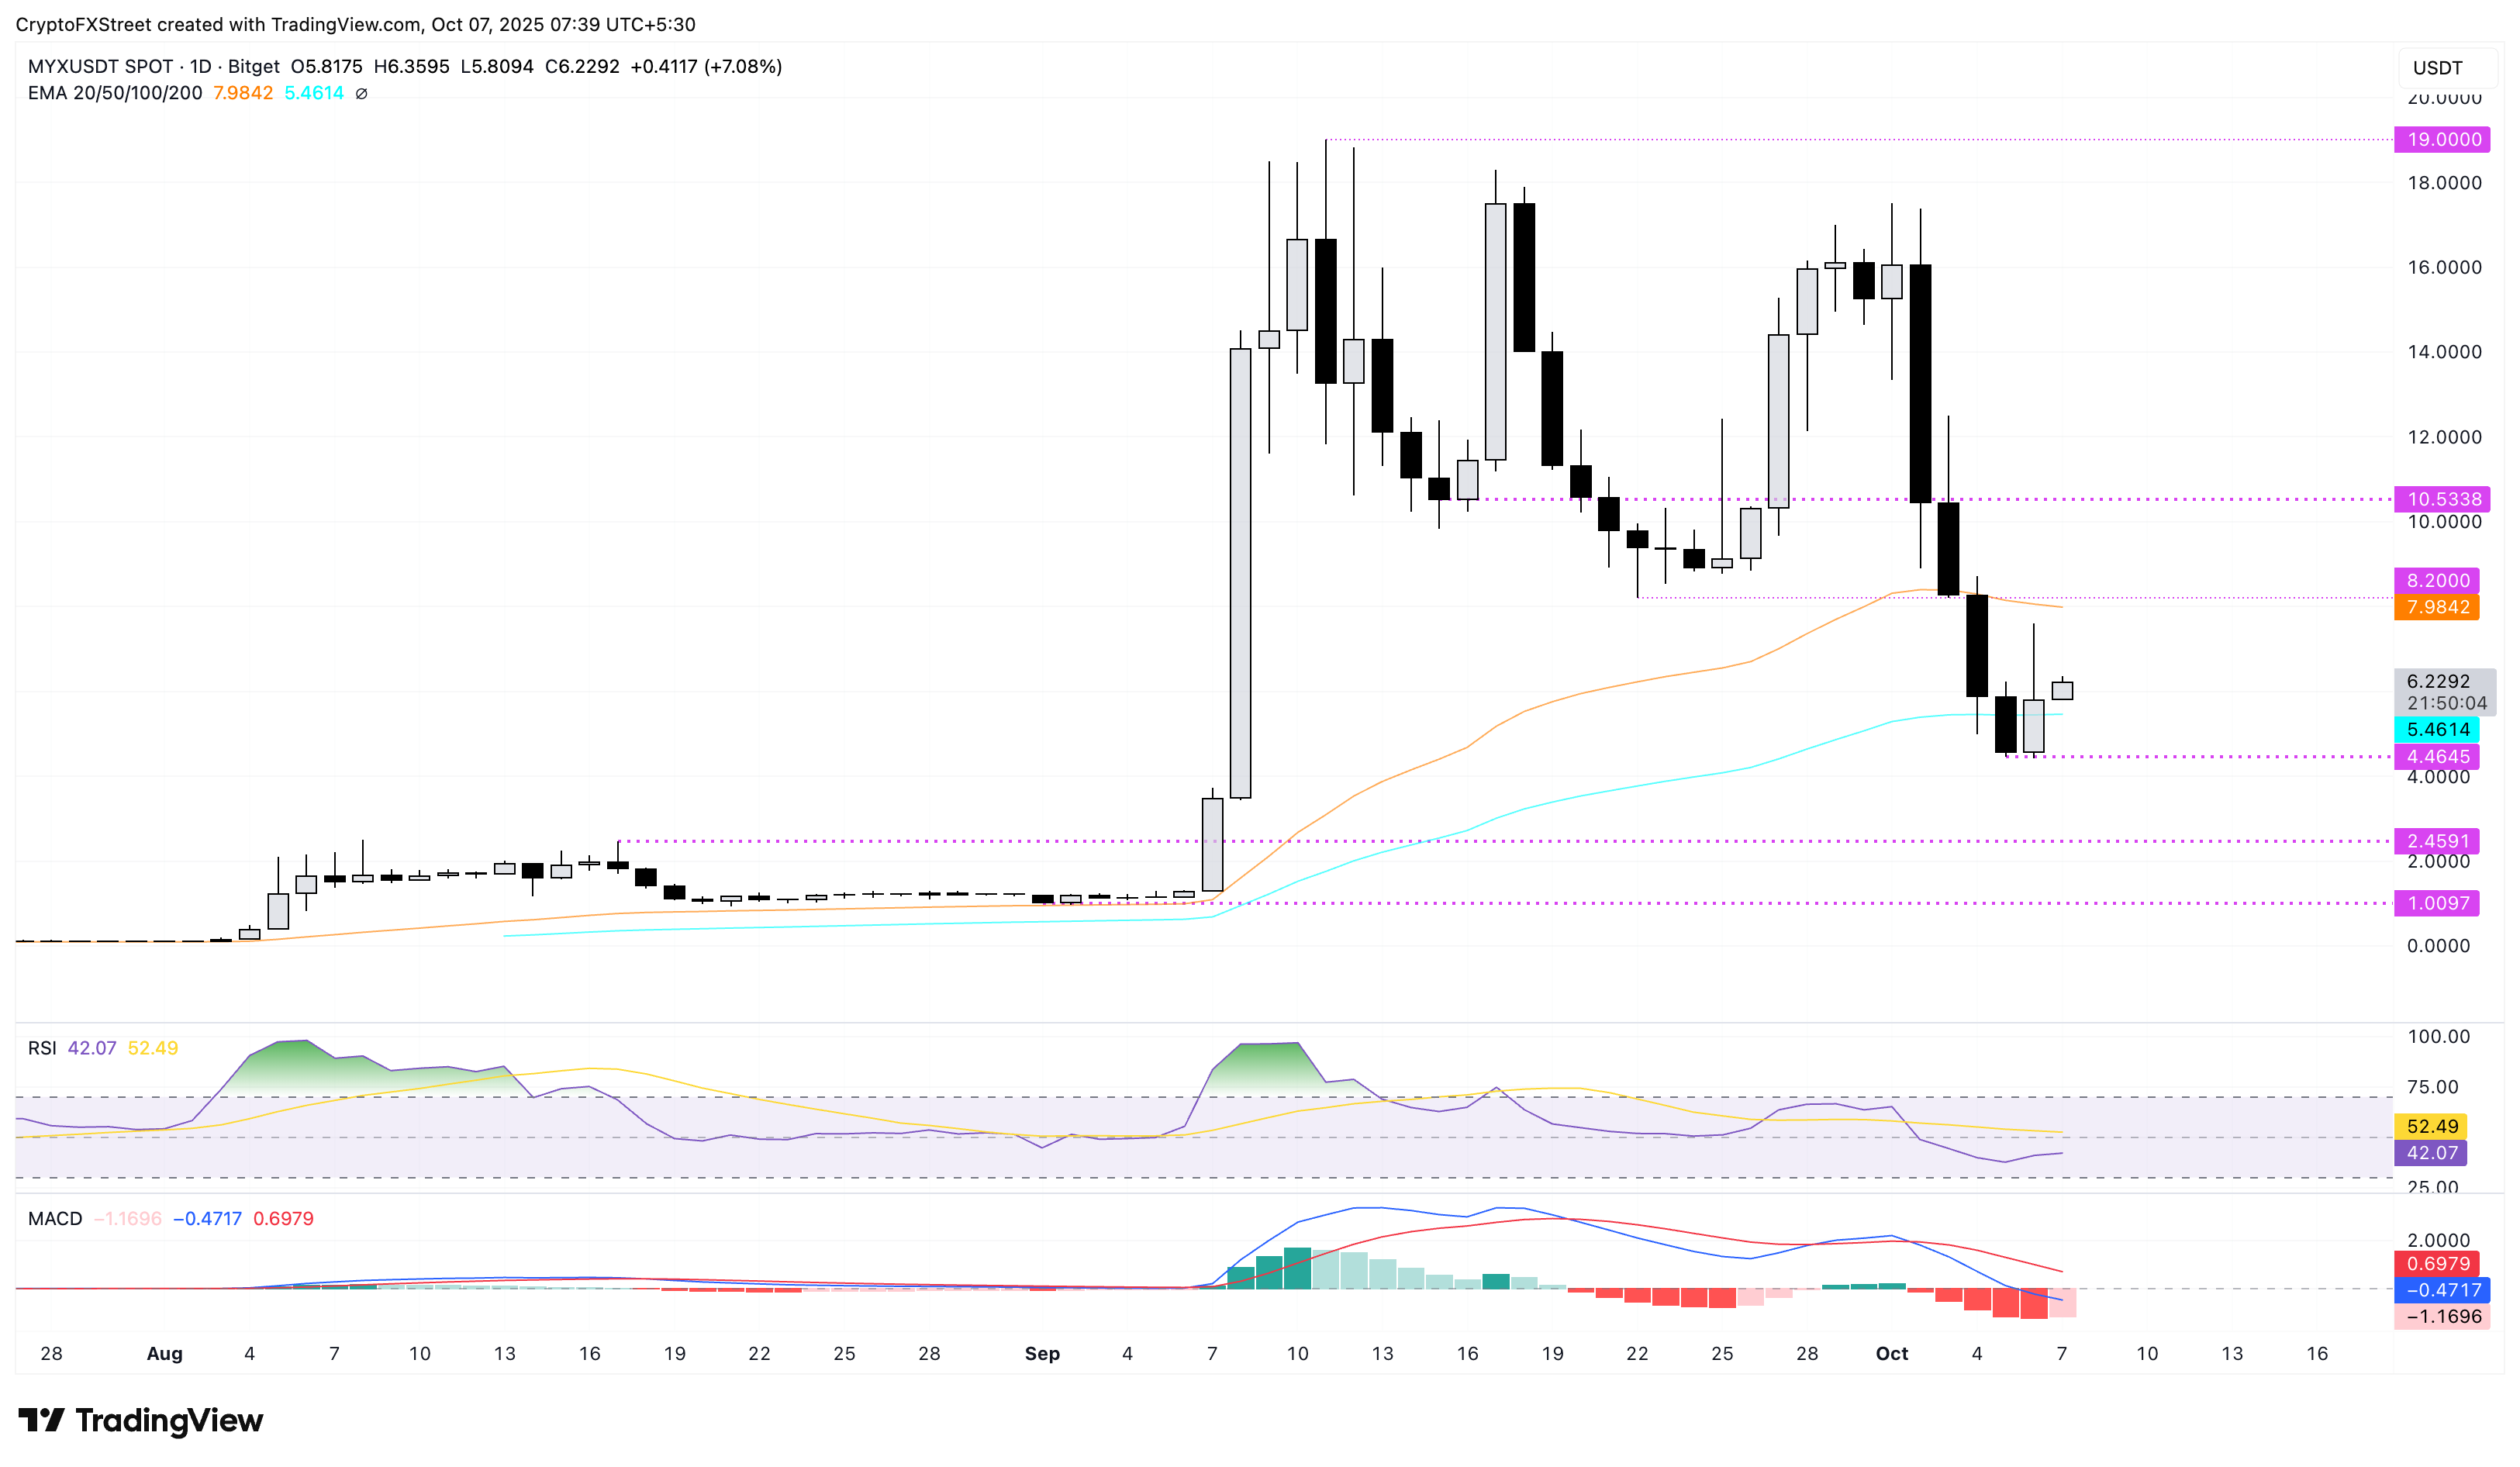
MYX/USDT daily price chart.
If MYX succumbs under overhead pressure, it could retest the $4.46 low from Sunday. Below this, the $2.45 level marked by the August 17 high could act as the next immediate support.
Plasma recovery signals further growth
Plasma marks its third consecutive day of gains, recovering after the 36% decline last week. At the time of writing, XPL records over 2% gains on Tuesday, extending the 12% rise from Monday.
The reversal in XPL has crossed above the $1.00 psychological level and is approaching the $1.09 level, marked by the high of October 1. A decisive close above this level could stretch the XPL run to $1.39, a support level formed on the 4-hour chart on September 28.
The momentum indicators on the 4-hour chart signal a rise in bullish momentum as the RSI at 64 approaches the overbought zone and the MACD crosses above the zero line with the signal line following suit.
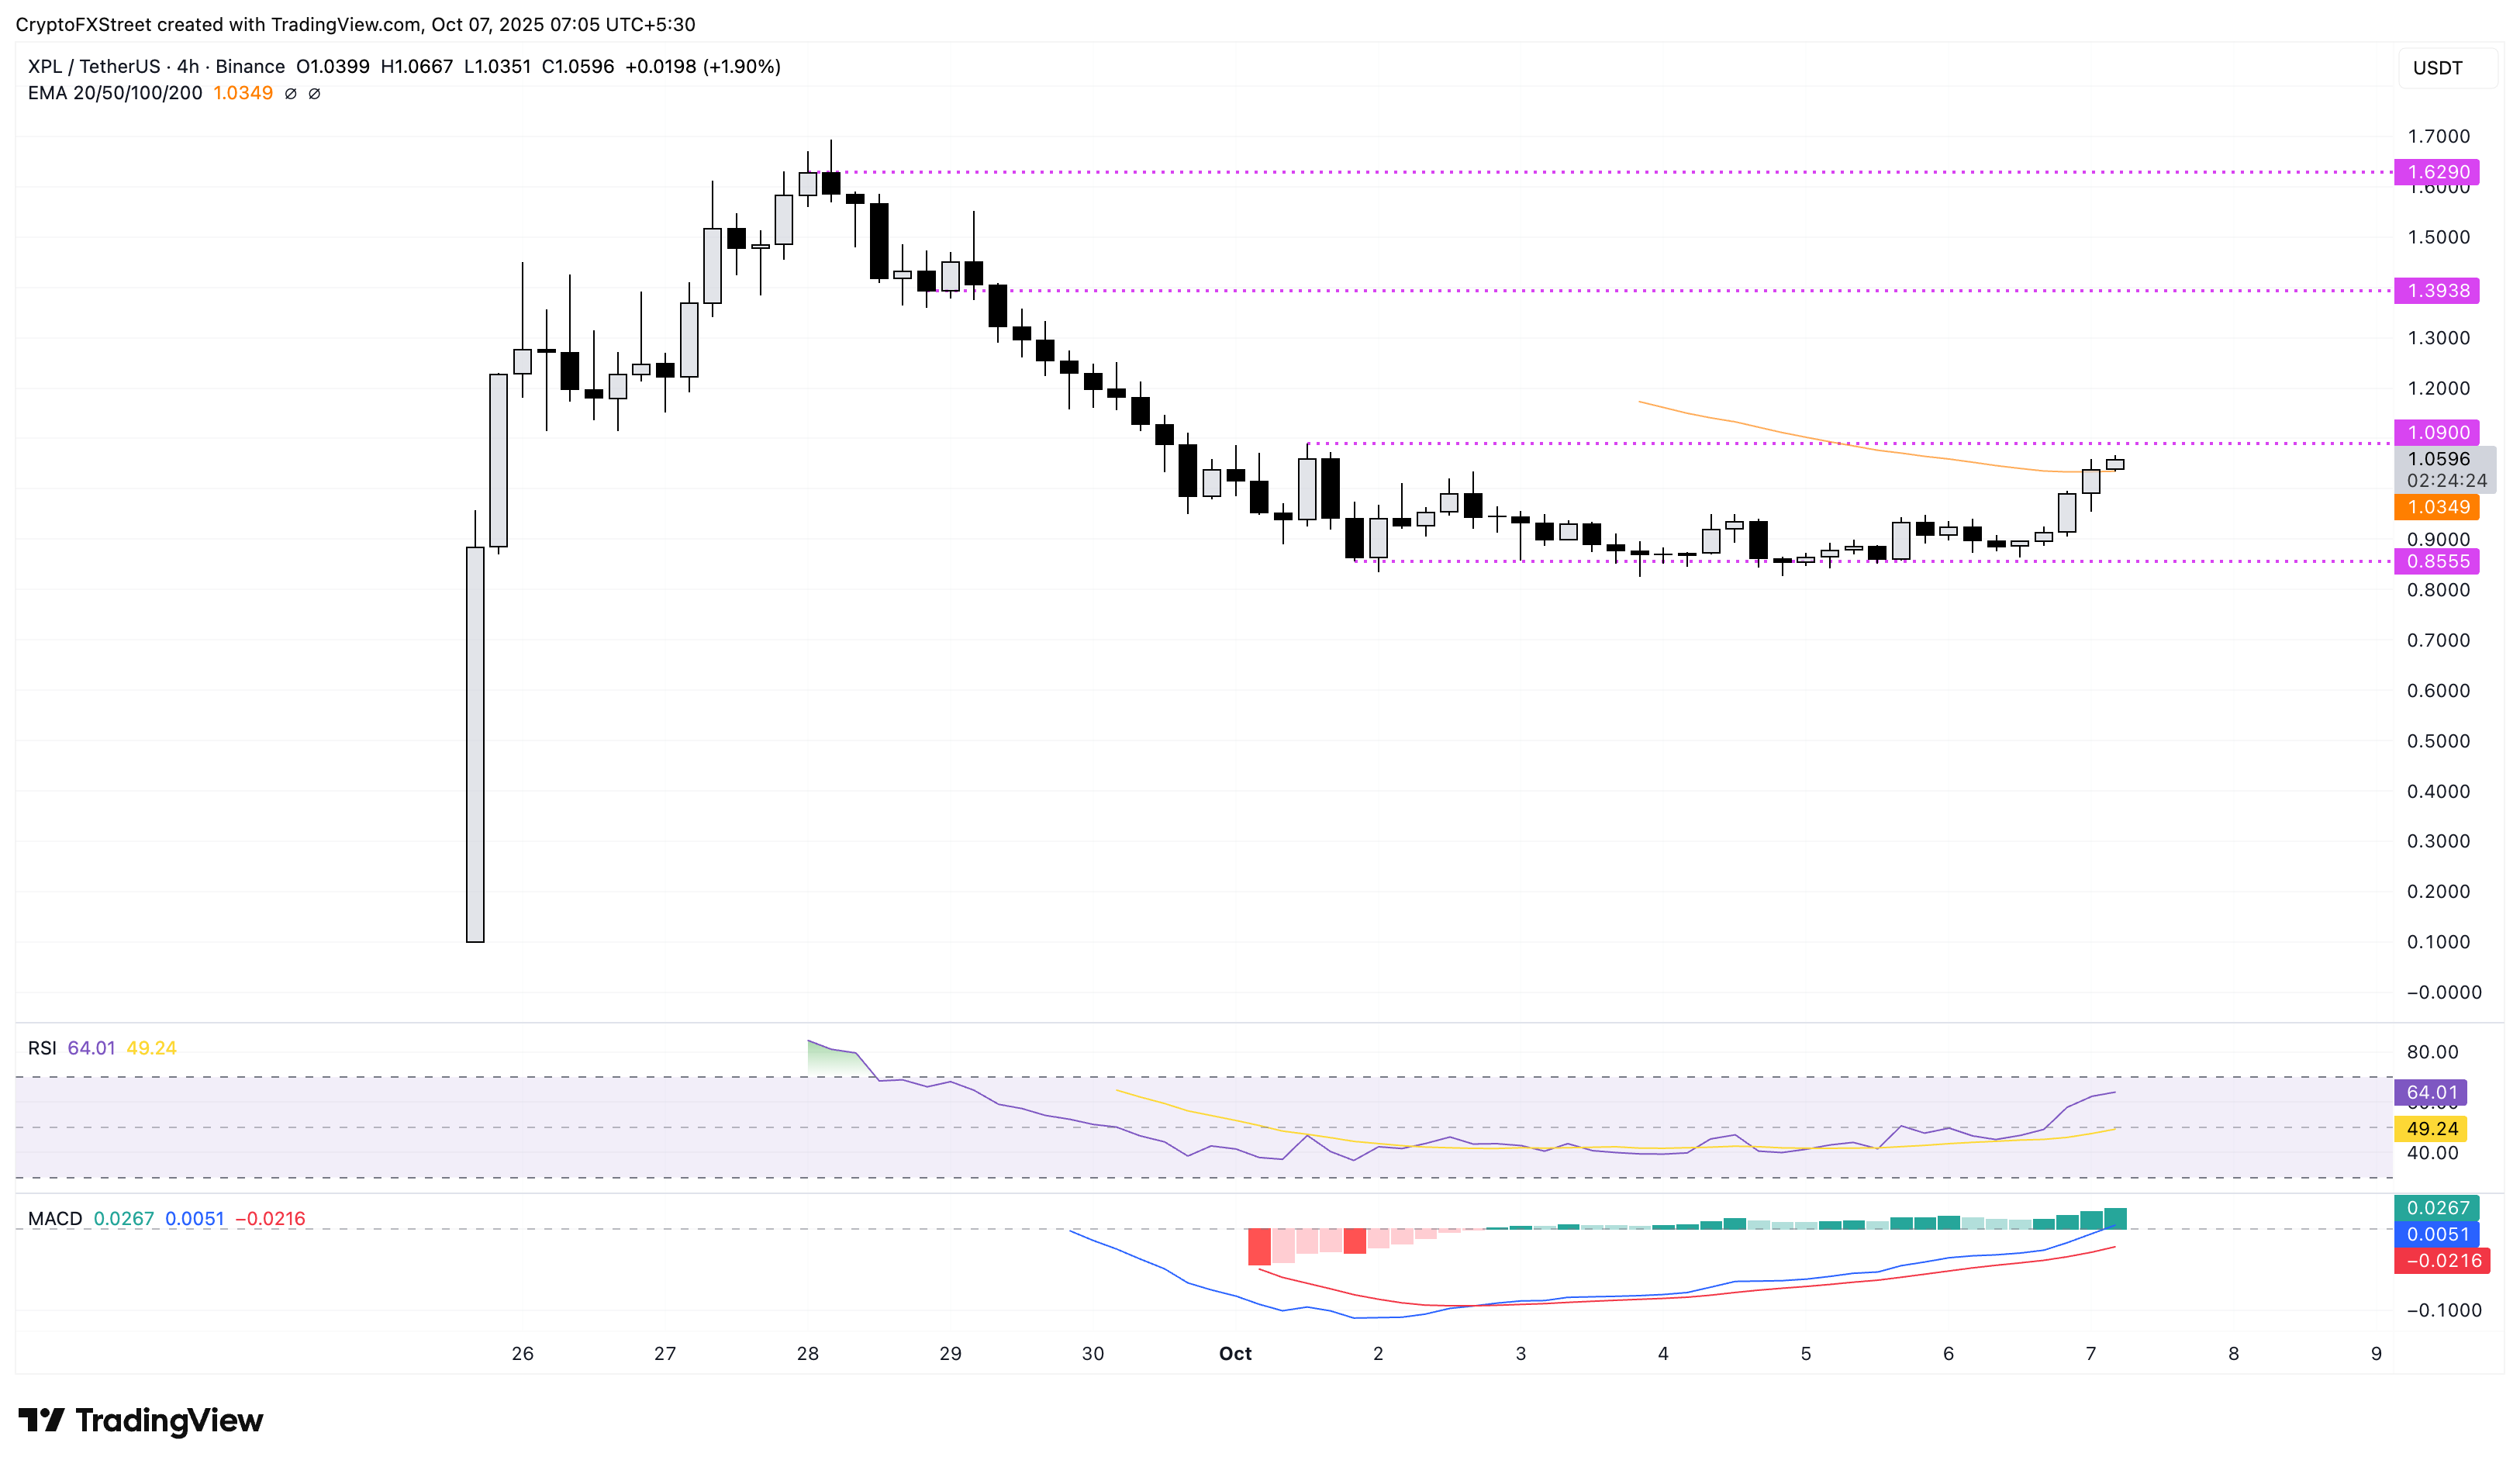
XPL/USDT 4-hour price chart.
On the other hand, if XPL reverses below the $1.00 mark, it could retest the $0.85 support level.
Mantle at record high levels takes a breather
Mantle breaks above a local resistance trendline to nullify the rising wedge pattern, as previously estimated by FXStreet. Still, MNT edges below by over 3% at press time on Tuesday, following a 17% jump on Monday, which resulted in a fresh record high of $2.48.
The pullback marks a reversal from the R2 resistance level at $2.47, and a decisive close above this could extend the rally to the R3 level at $2.99.
The RSI reads 70 on the daily chart (overbought), which suggests elevated buying pressure. Meanwhile, the MACD and its signal line extend the uptrend, indicating a rise in bullish momentum.
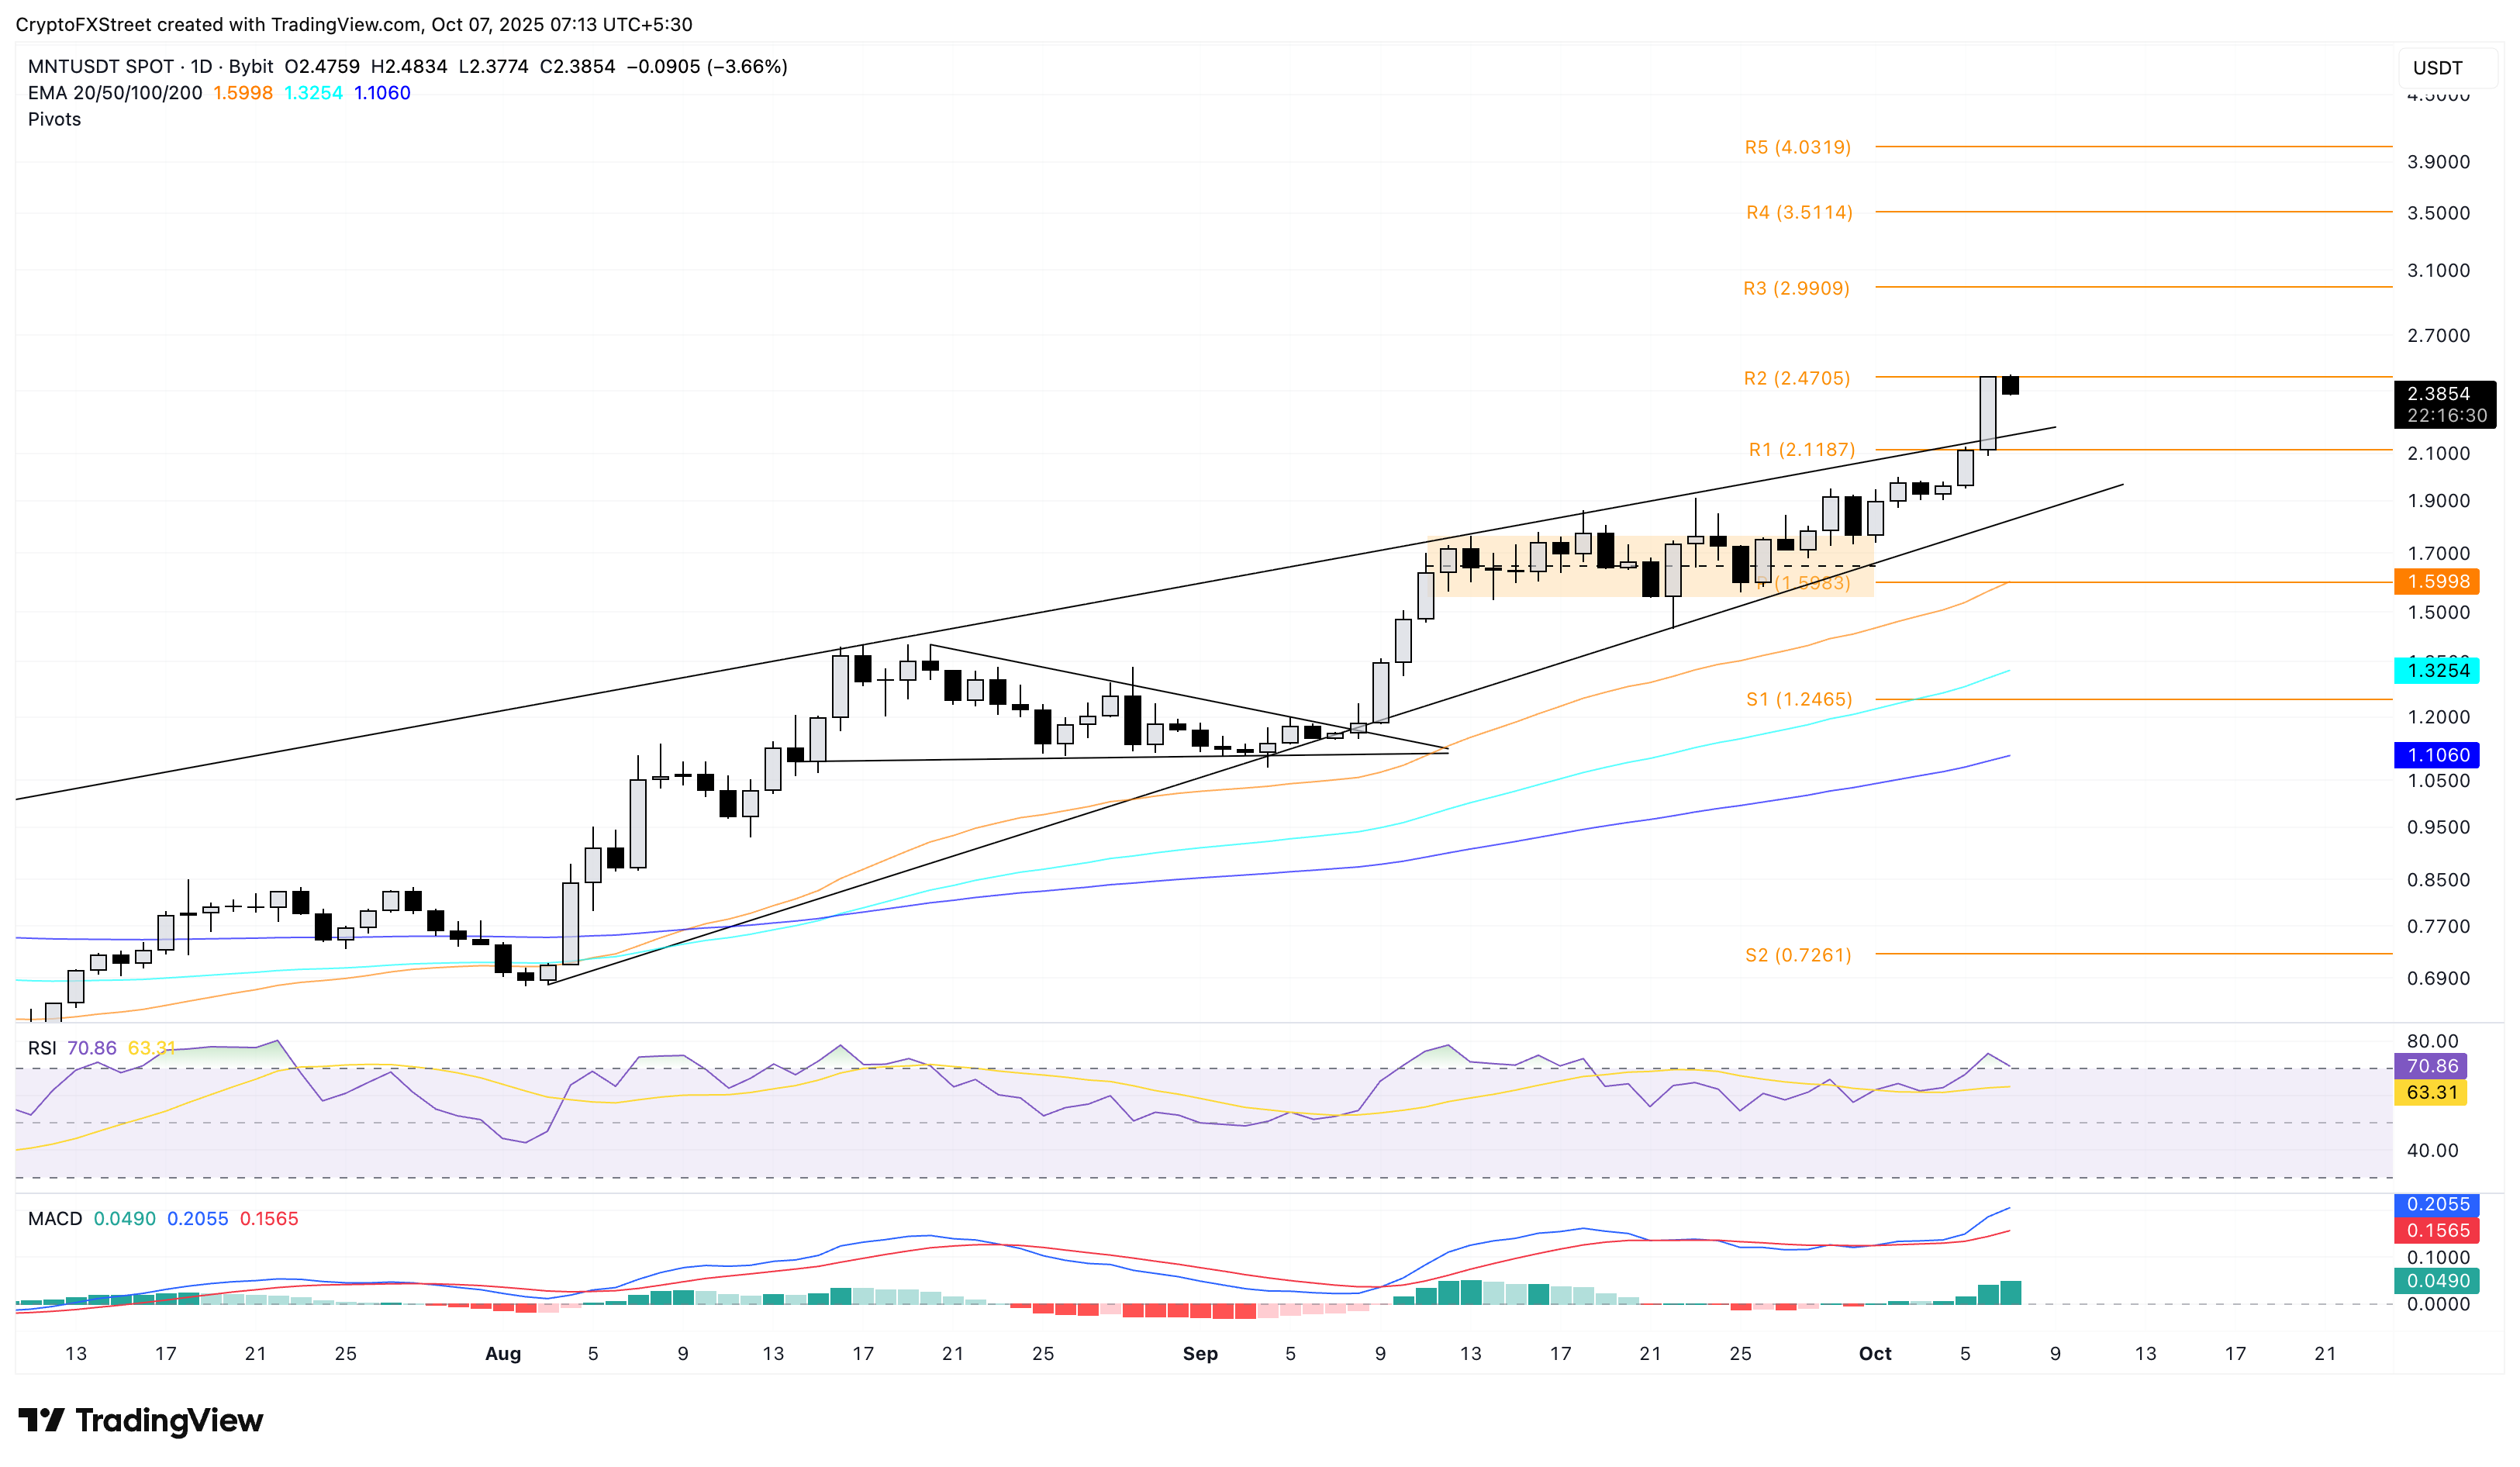
MNT/USDT daily price chart.
Looking down, an extended pullback could test the resistance-turned-support R1 pivot level at $2.11.
PancakeSwap extends triangle breakout rally
PancakeSwap holds steady above $3.75 on Tuesday, following a nearly 17% jump on Monday that formed a bullish engulfing candle. The bounce back from the $3.165 level targets the $4.194 level, marked by the December 9 high.
The Decentralized Exchange (DEX) token is gaining traction, as indicated by the RSI at 69, which hovers near the overbought boundary, while the MACD and signal line show a steady upward trend.
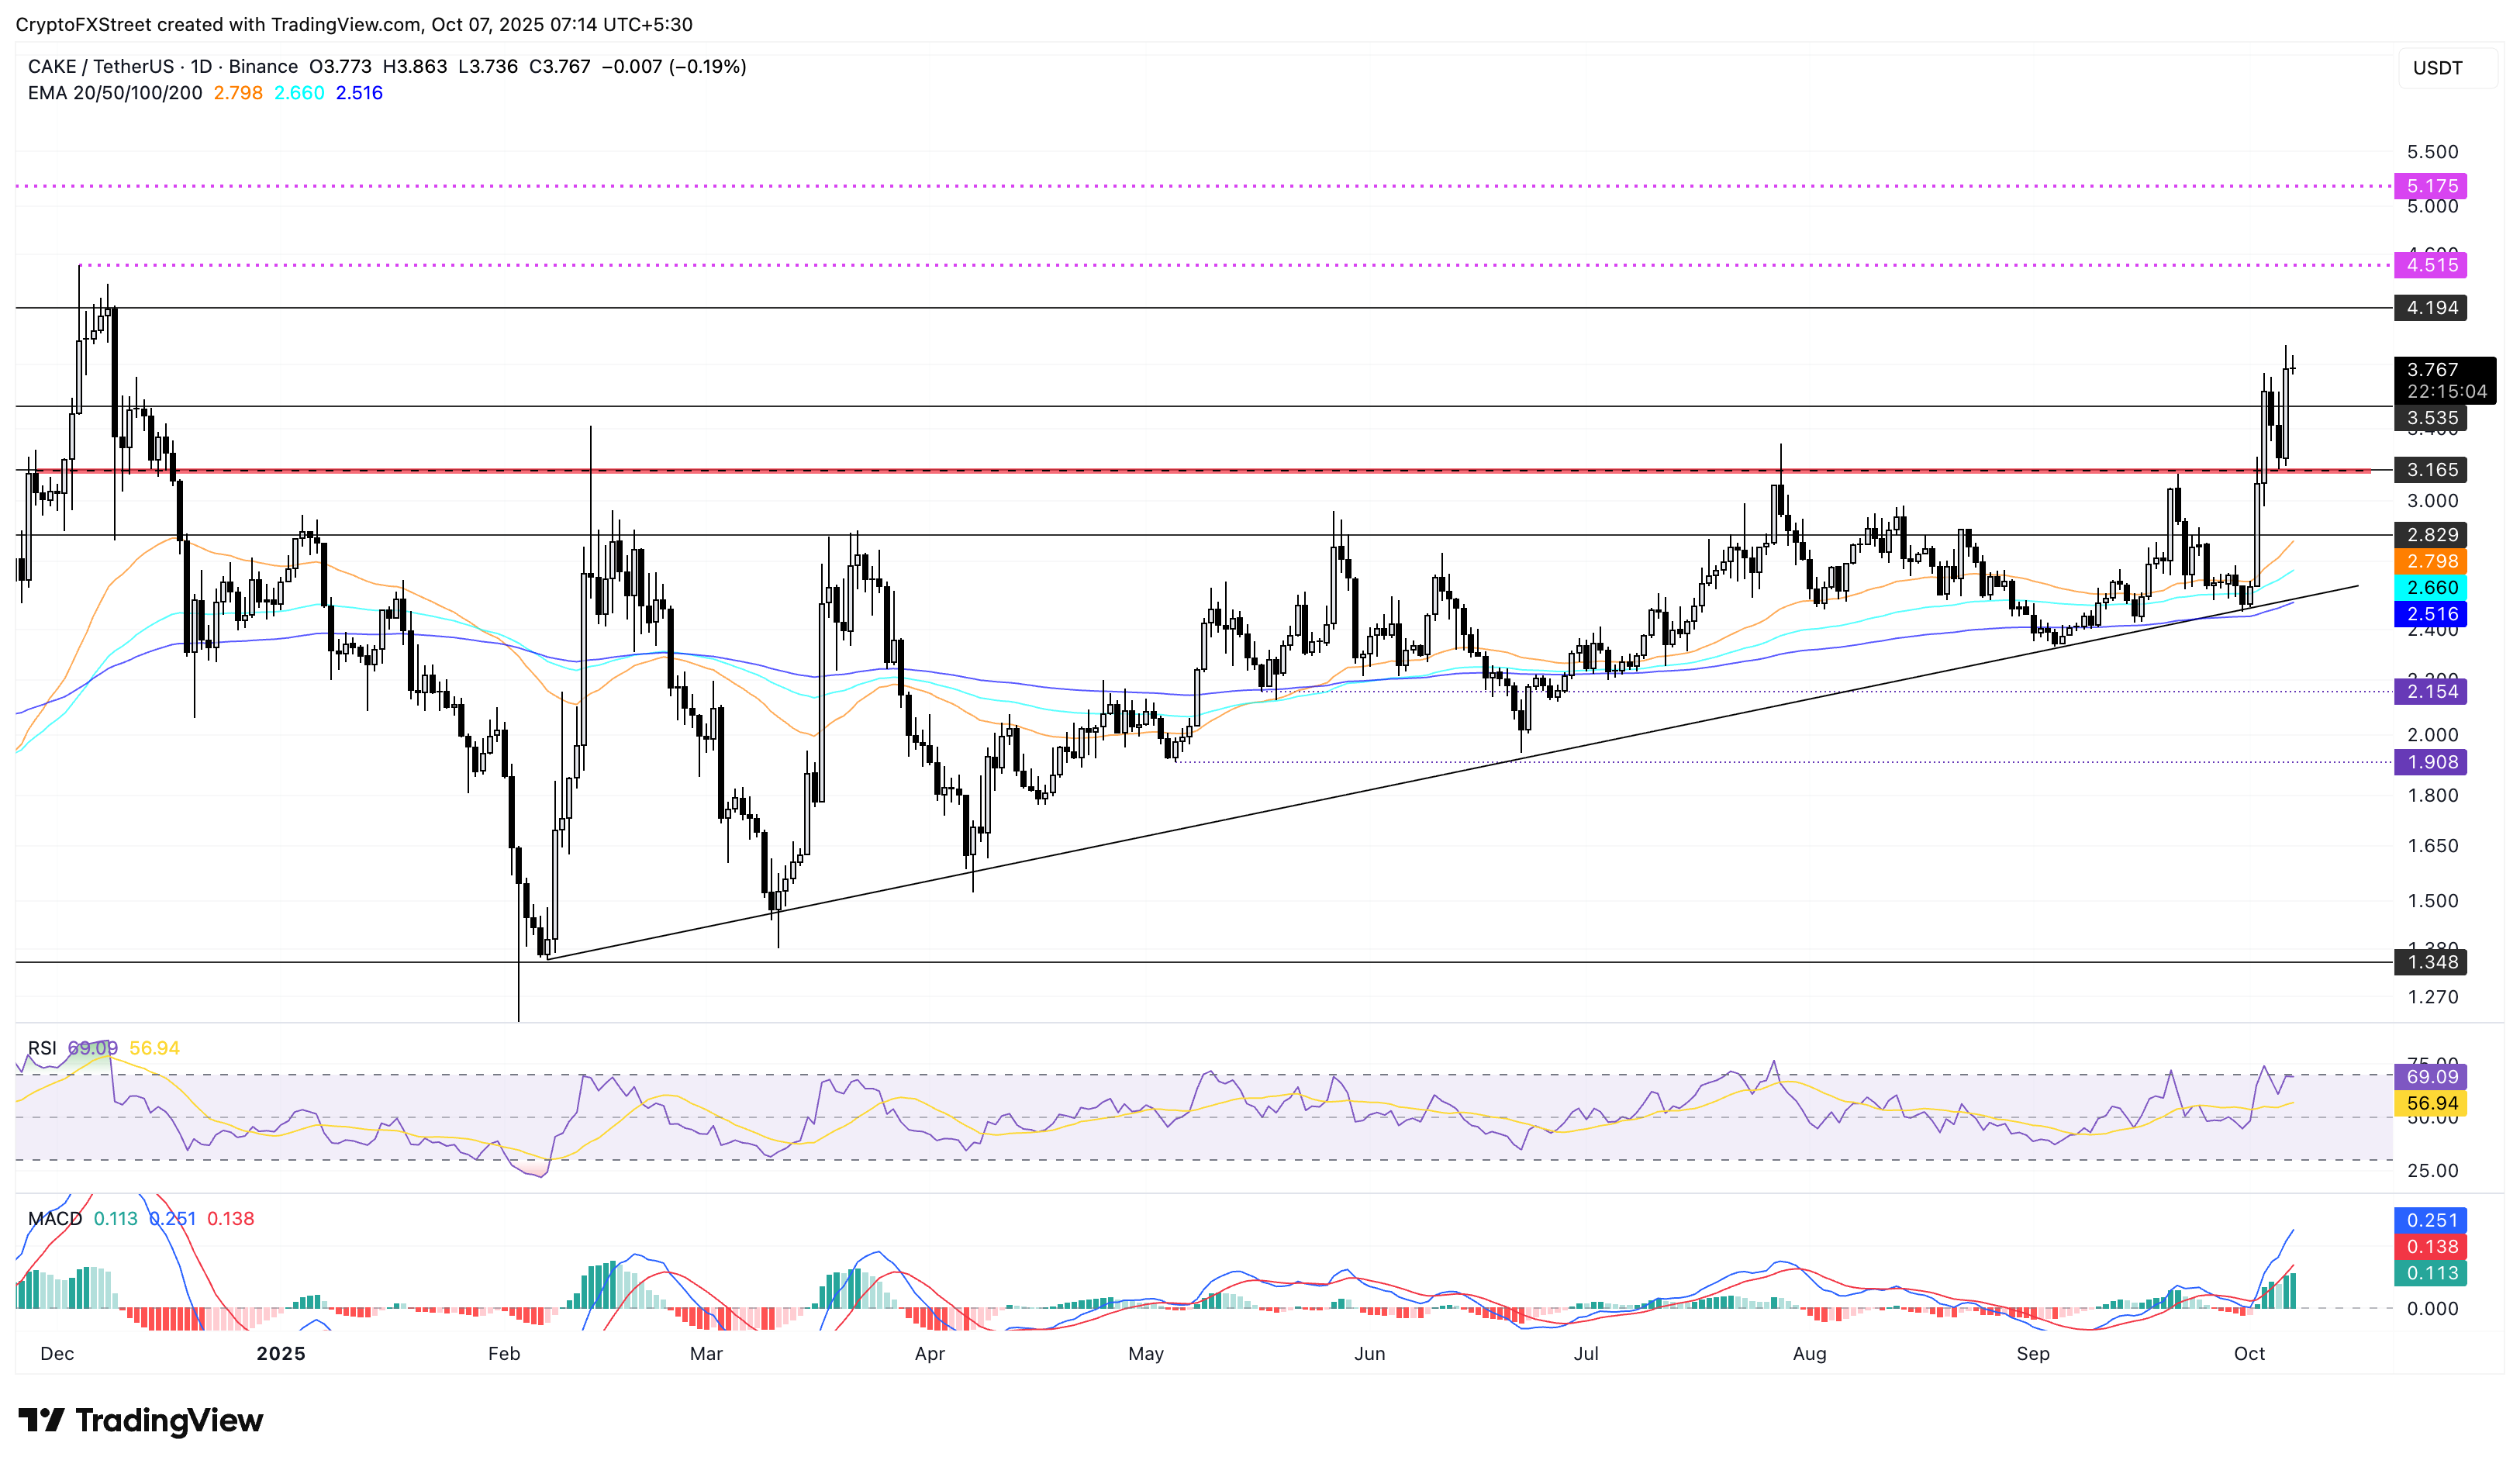
CAKE/USDT daily price chart.
If CAKE flips below $3.500 psychological level, it could retest the $3.165 support zone, which previously acted as the resistance band of an ascending triangle pattern.
Artigos Recomendados


