
Pump.fun token nears all-time high as bullish momentum builds on strong revenues
- Pump.fun’s token PUMP inches closer to record all-time high.
- Weekly protocol revenues hold above $10 million for four consecutive weeks.
- Derivatives data suggest an increase in traders' confidence.
Pump.fun (PUMP) price trades above $0.008000 level at the time of writing on Thursday, extending the 4.77% gains from Wednesday. The token launchpad protocol records steady weekly revenues of over $10 million, indicating consistent demand for meme coins generations in the crypto market.
Amid sustained capital inflows, the derivatives data and technical outlook suggest a potential rise to a record high.
Pump.fun records strong revenues
A streamlined inflow of revenue suggests a steady demand for a protocol. The weekly revenues for Pump.fun have stayed over $10 million in the previous four straight weeks, suggesting a high demand for token generation in the cryptocurrency market. The revenue has reached $8.65 million so far this week, and it is likely to continue the streak.
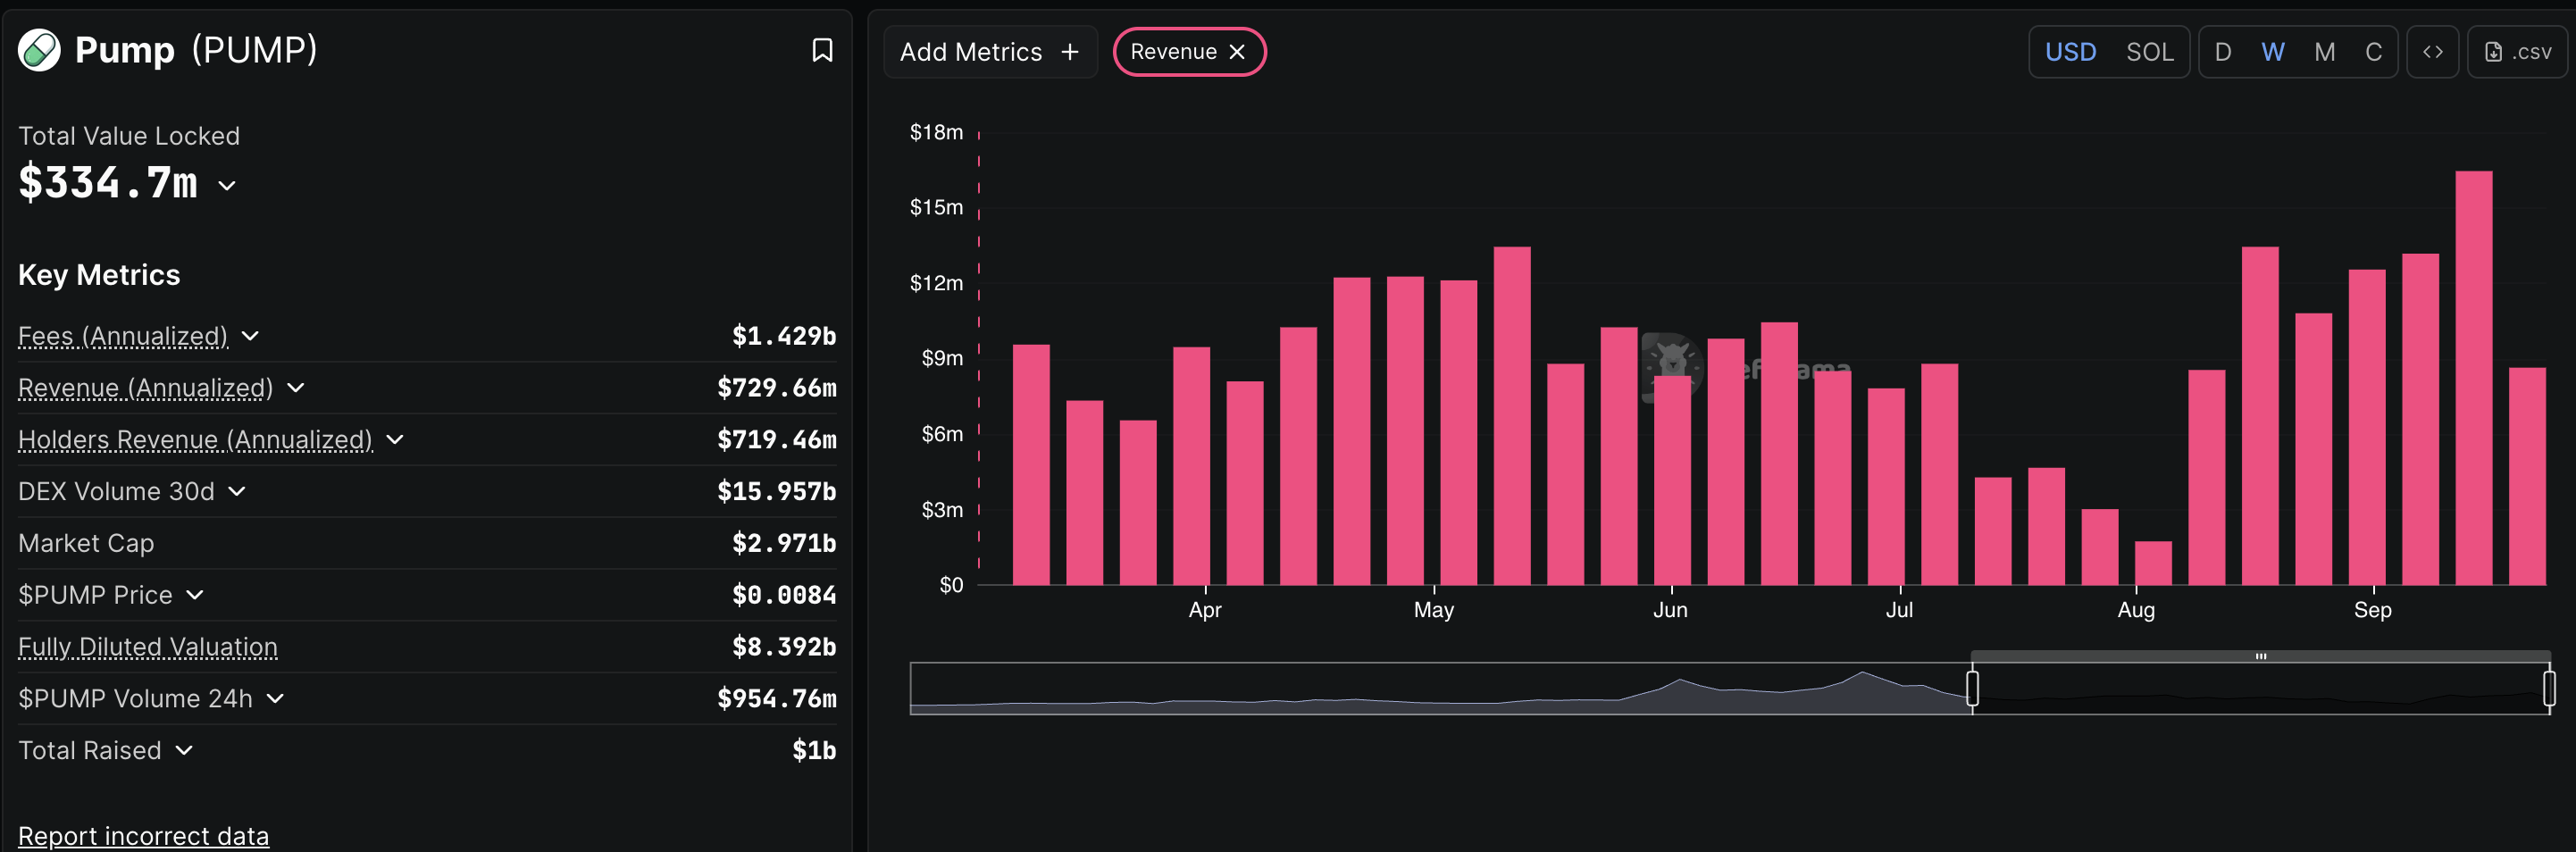
Pump.fun weekly revenues. Source: DeFiLlama
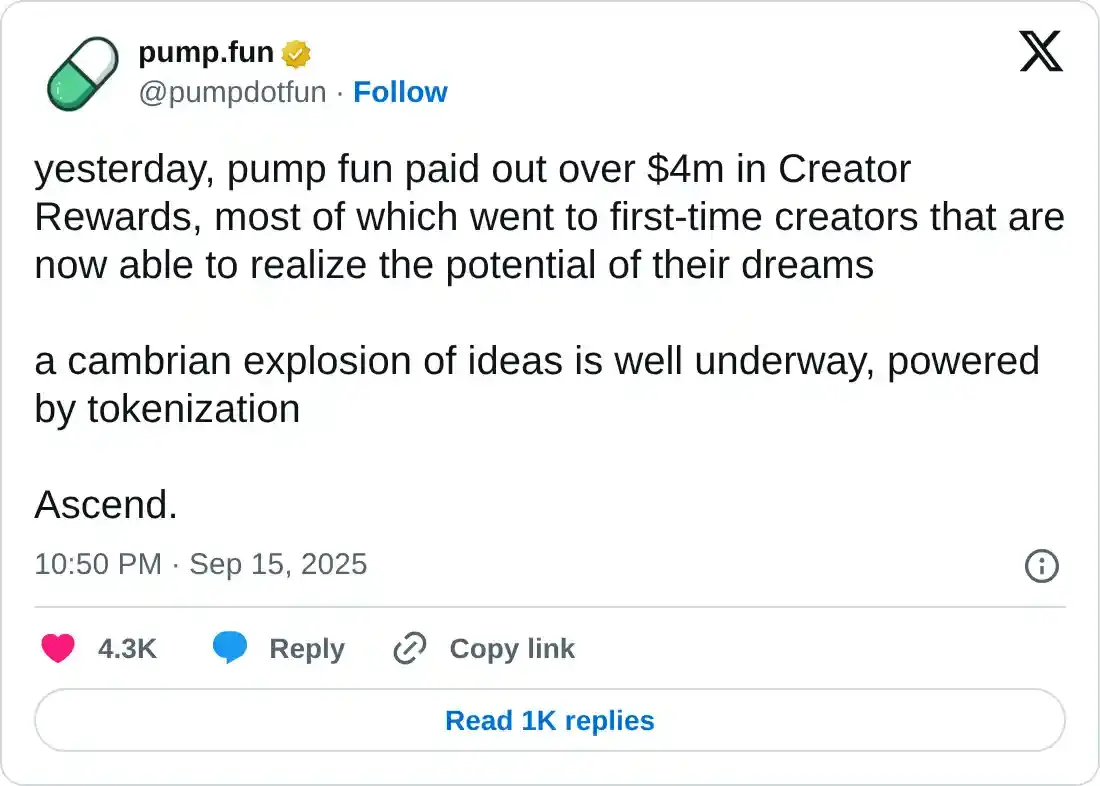
Amid the heightened interest, Pump.fun recently paid out over $4 million in creator rewards, mainly to first-time creators, as posted on the official X account on Monday. This indicates increased adoption of the platform.
Bullish bets on the rise
CoinGlass data shows that the PUMP Open Interest stands at $1.22 billion, up from $1.08 billion on Wednesday. This sudden capital inflow in the PUMP derivatives indicates increased interest of traders, signaling a risk-on sentiment.
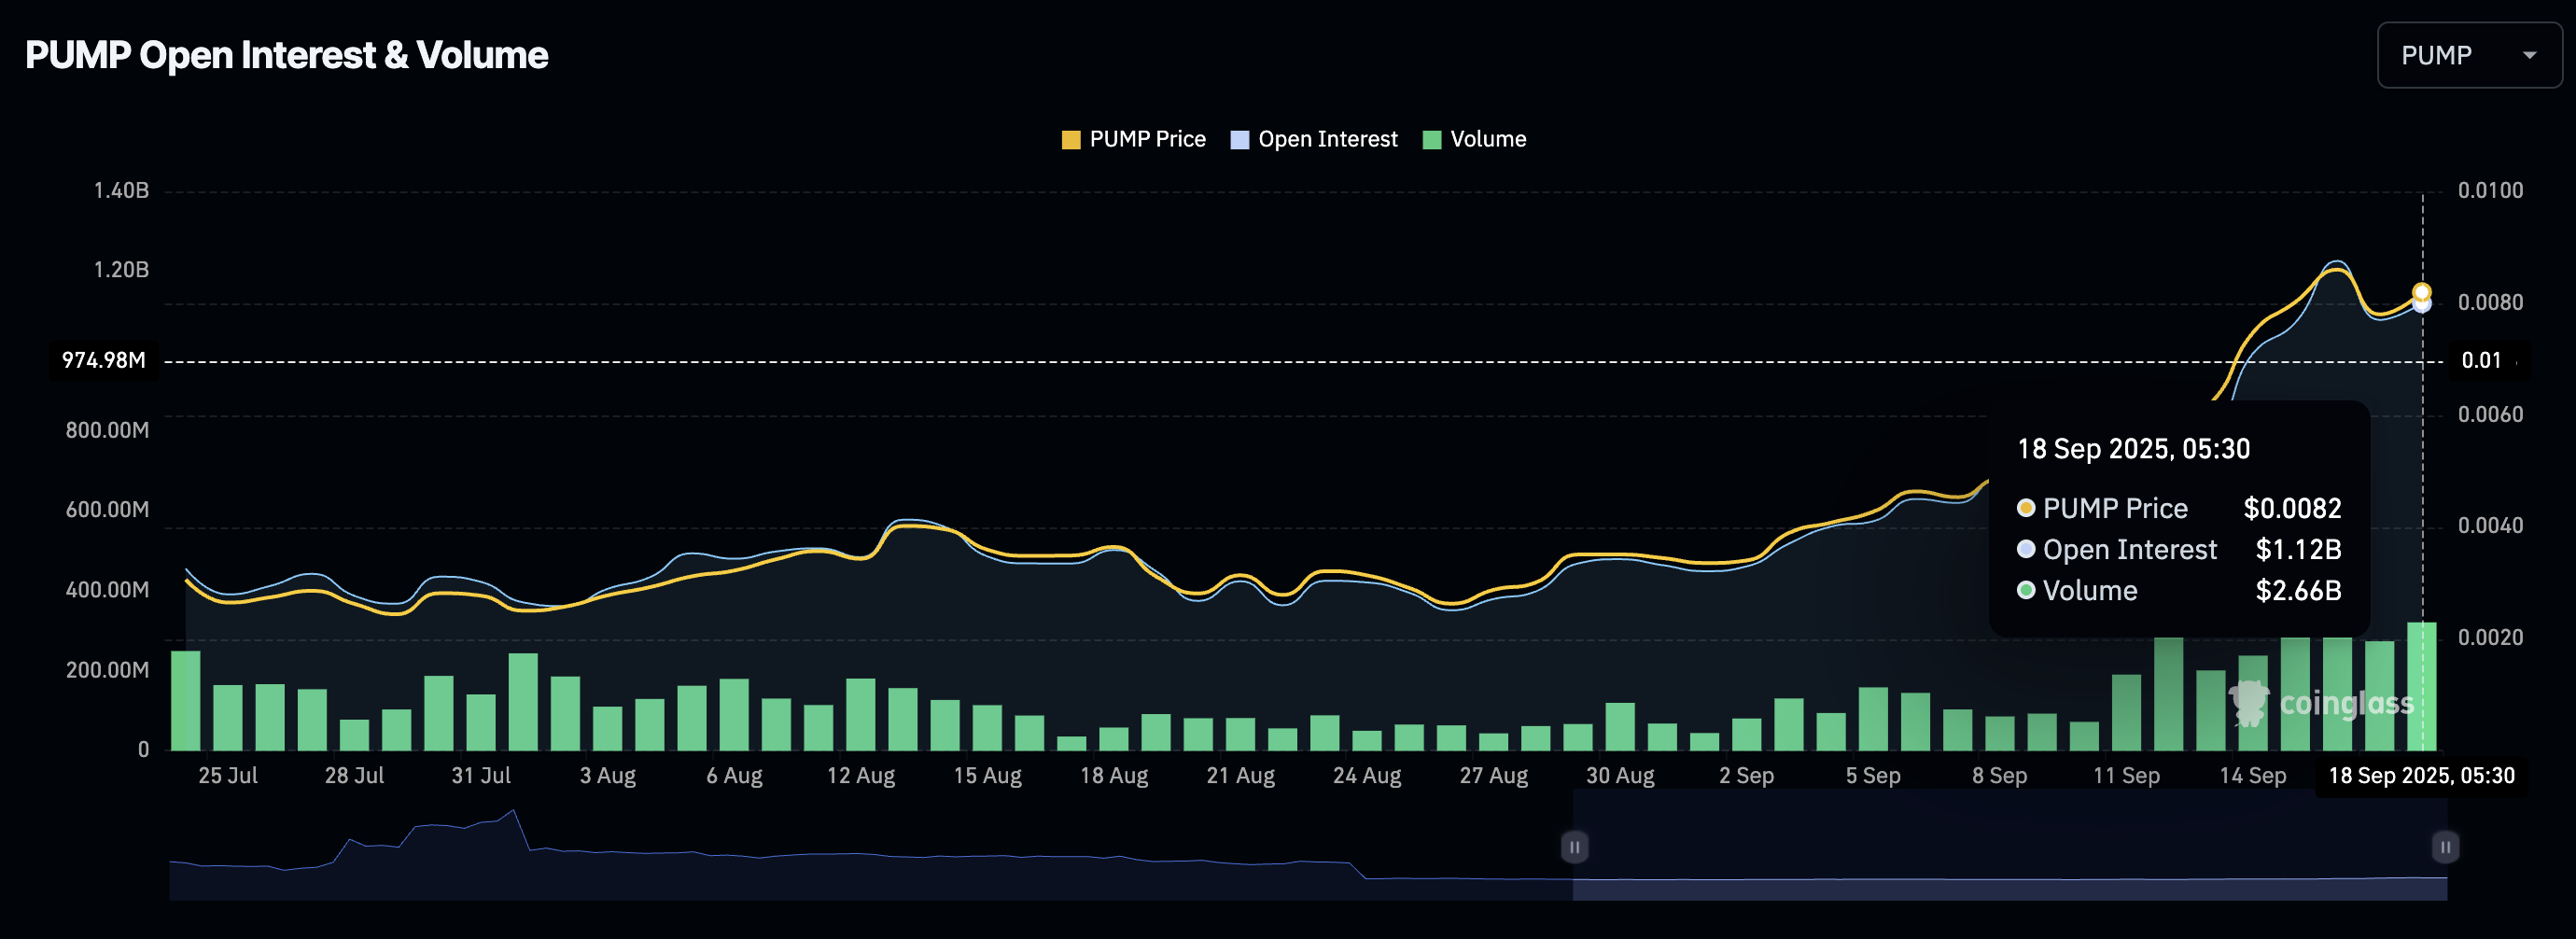
PUMP Open Interest. Source: CoinGlass
Adding to the optimism, an increase in the Taker Buy/Sell Volume indicator shows that long positions have surged to 51.79%, from 50.01% in the last 24 hours.
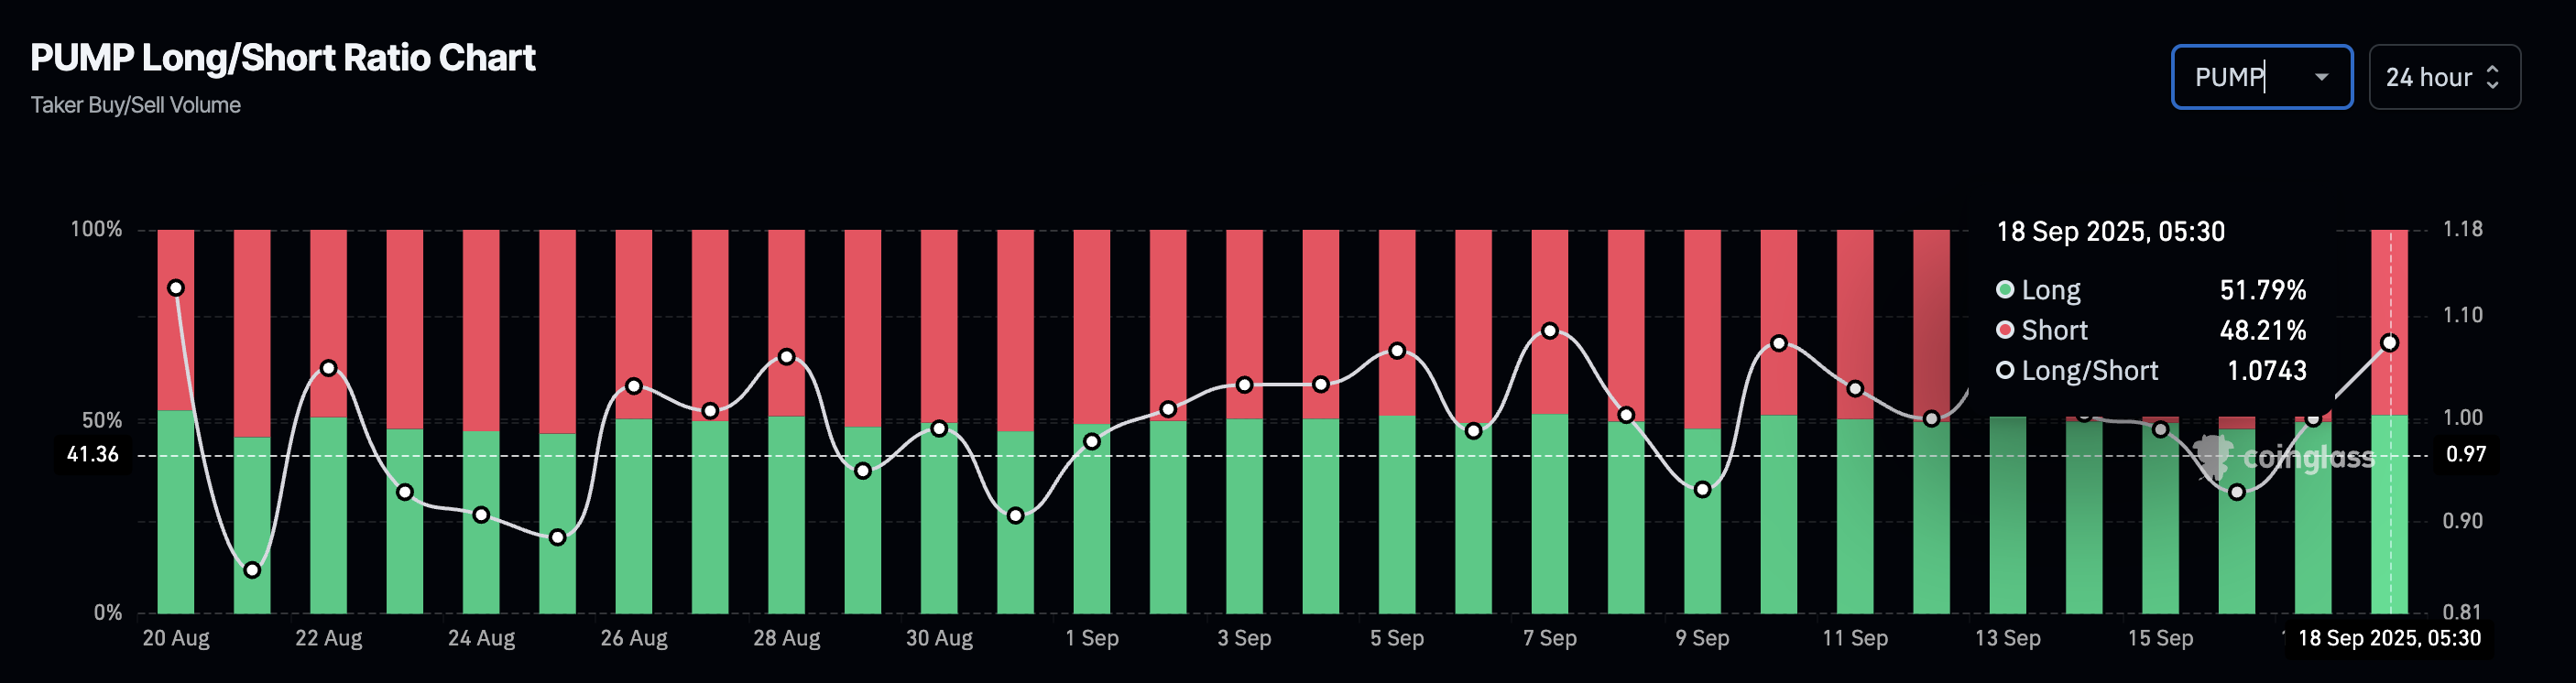
PUMP Long/Short Ratio. Source: CoinGlass
PUMP prepares for further recovery
PUMP edges higher by 1% at press time on Thursday, surpassing a short-term resistance trendline that marks a bullish flag pattern breakout on the 4-hour chart. The breakout rally targets the R1 pivot level at $0.009793, which acts as the immediate resistance.
Adding to the upward trend, the Moving Average Convergence Divergence (MACD) rises towards its signal line, hinting at a potential crossover as bearish momentum declines. Furthermore, the Relative Strength Index (RSI) holds steady above the halfway line at 60, suggesting that the buying pressure is heightened.
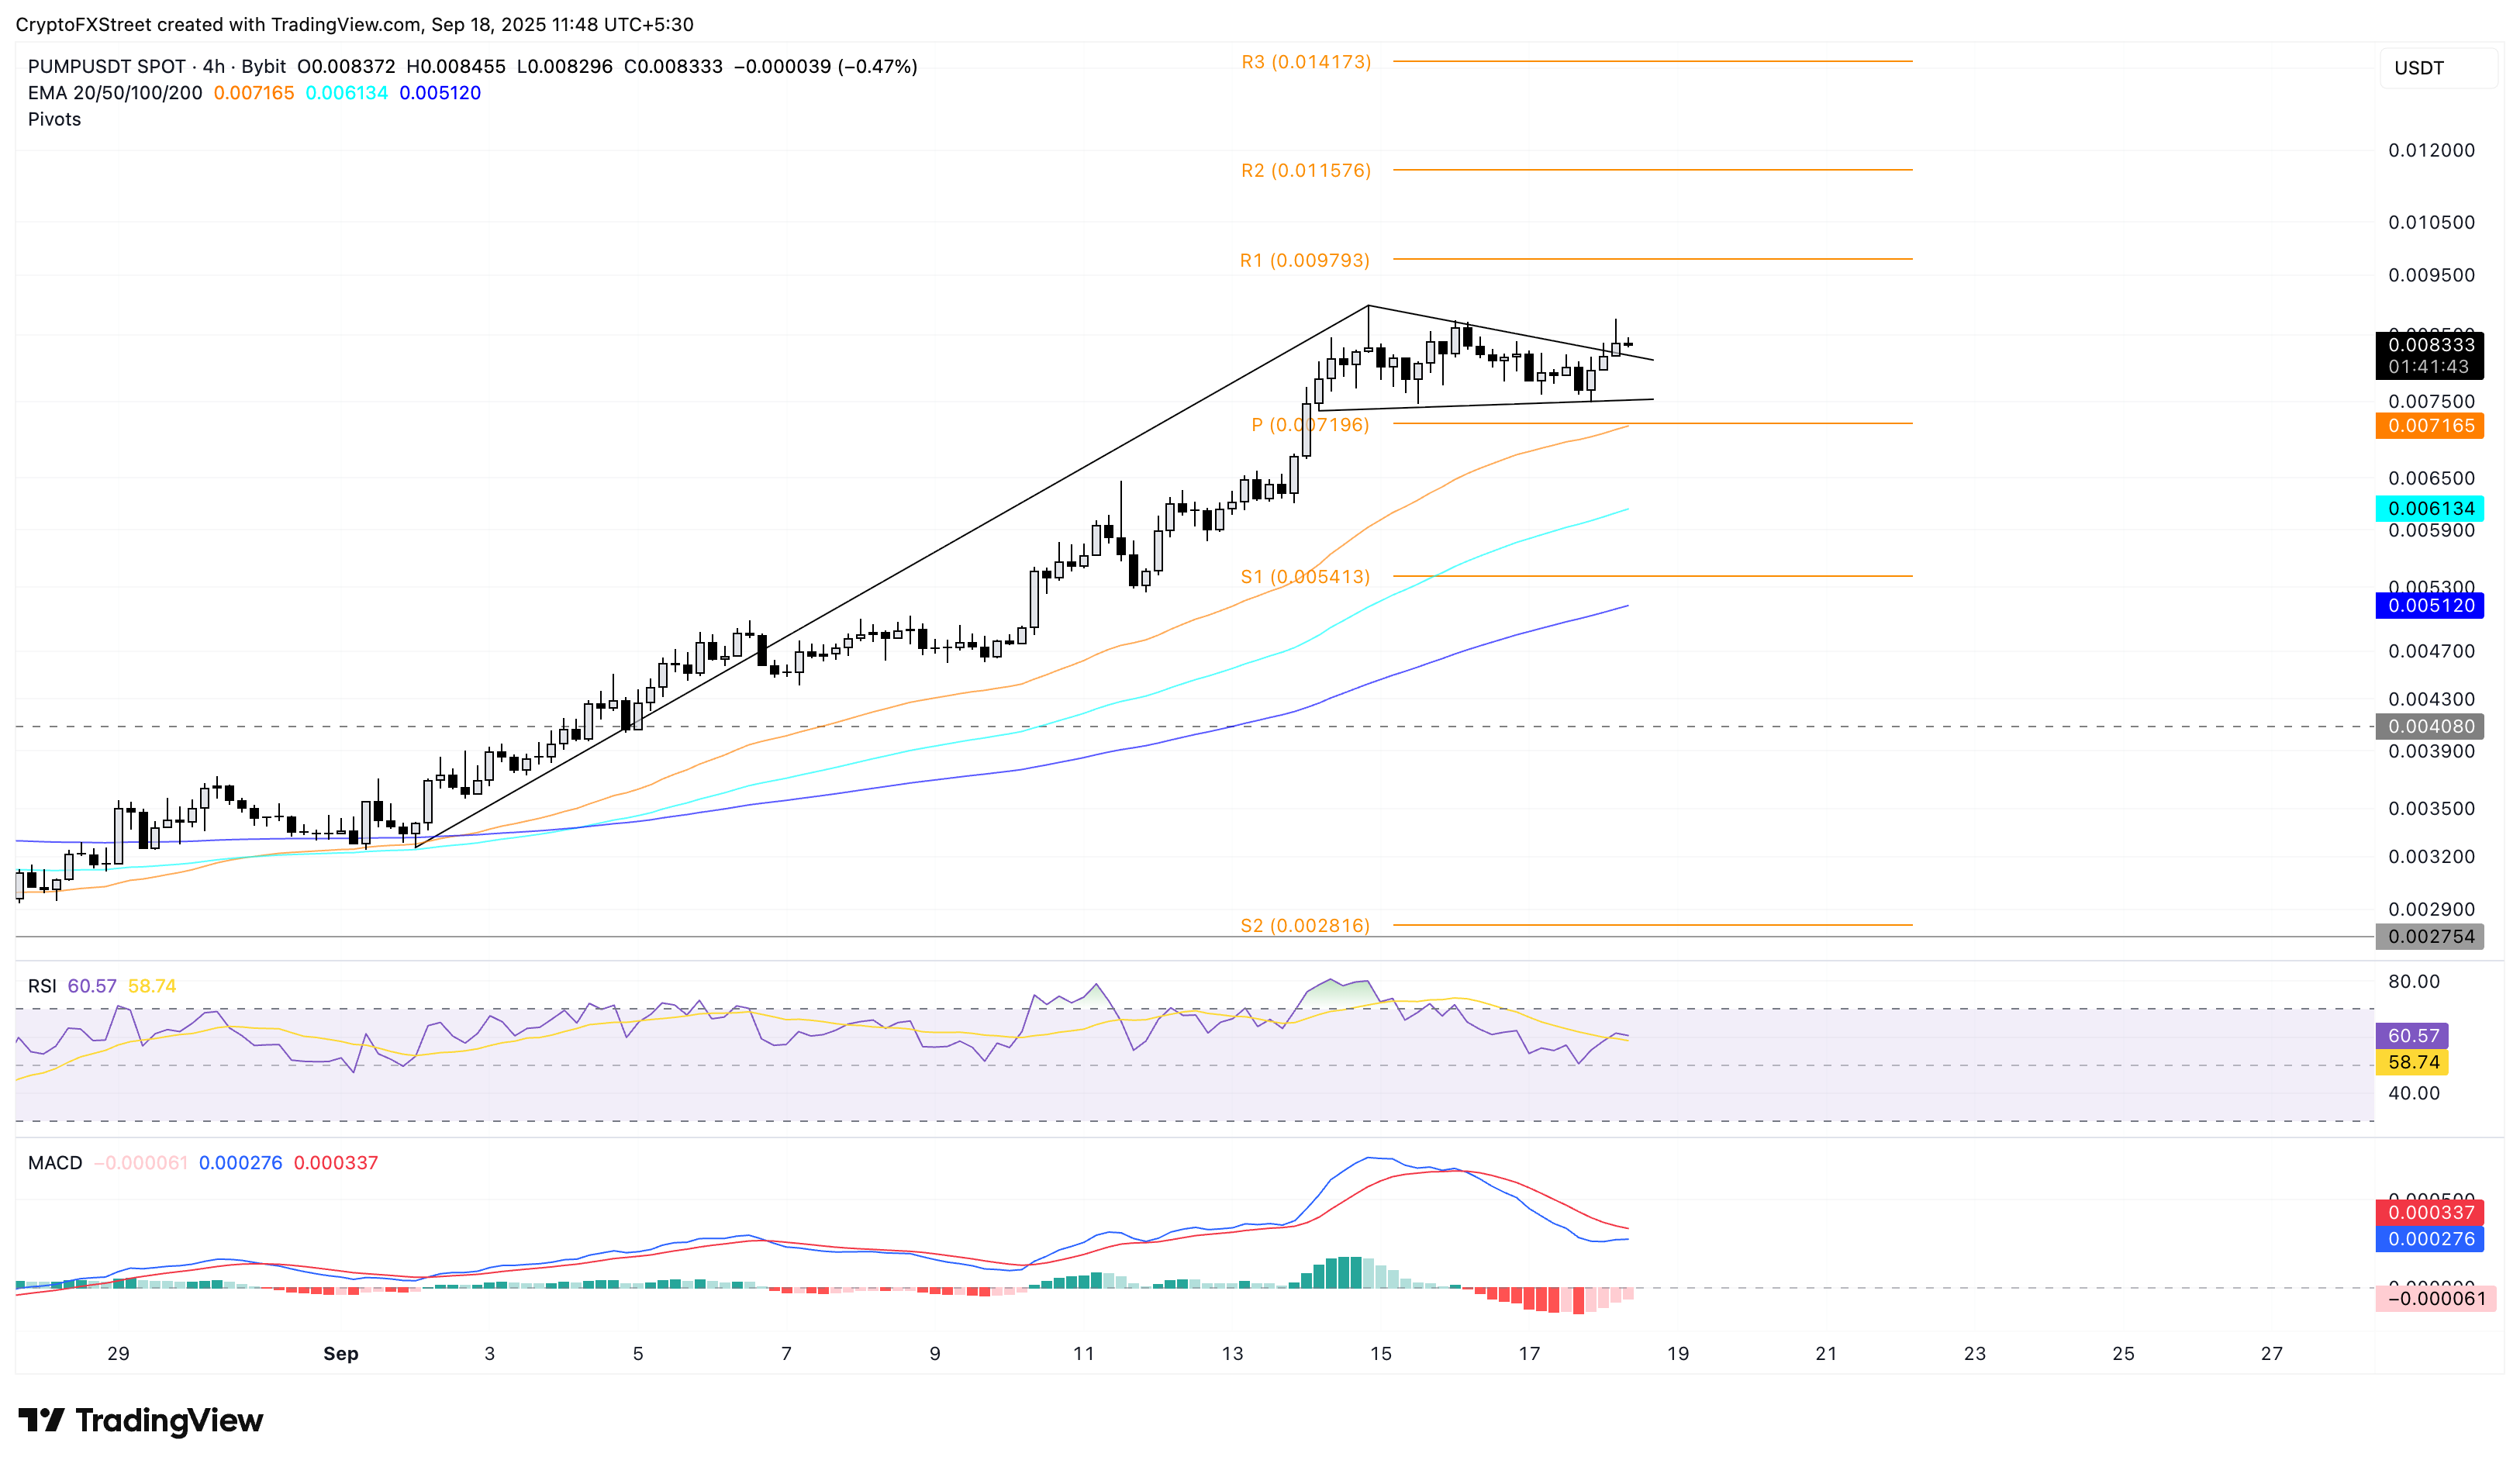
PUMP/USDT 4-hour price chart.
On the downside, a potential pullback under the 50-period Exponential Moving Average (EMA) at $0.007165 would invalidate the pattern breakout. This could result in a decline to the 100-period EMA at $0.006134.
Artigos Recomendados


