US Dollar Index Price Forecast: Remains above 97.00, eyes nine-day EMA barrier

Fonte Fxstreet
  • The US Dollar Index may find immediate support at 97.00.
  • Bearish bias prevails as the 14-day Relative Strength Index remains below the 50 level.
  • The initial barrier lies at the nine-day EMA of 97.32.

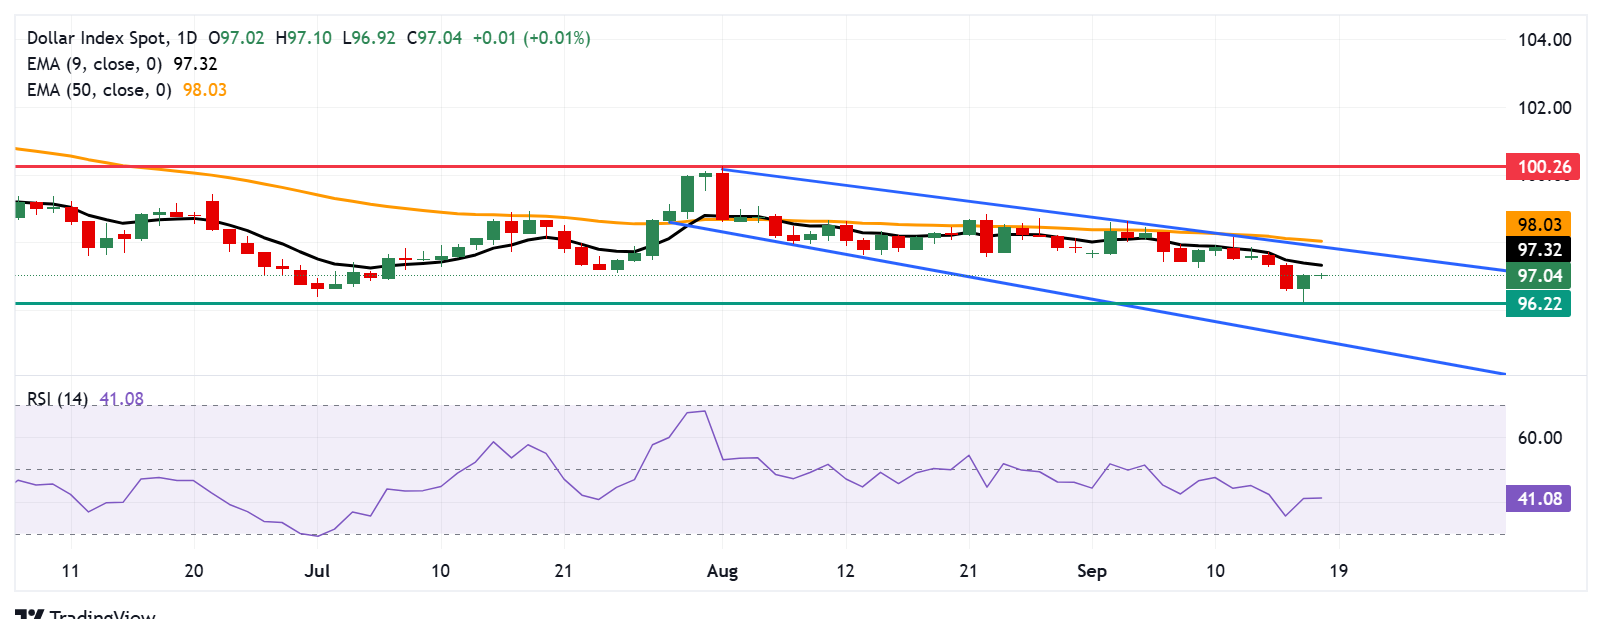
The US Dollar Index (DXY), which measures the value of the US Dollar (USD) against six major currencies, is holding ground and trading around 97.00 during the Asian hours on Thursday. The technical analysis of the daily chart shows the dollar index remaining within the descending channel pattern, suggesting an ongoing bearish bias.

The 14-day Relative Strength Index (RSI) holds below the 50 level, strengthening the bearish bias. Additionally, the short-term price momentum is weaker as the DXY is positioned below the nine-day Exponential Moving Average (EMA).

On the downside, the US Dollar Index is testing its immediate support at the psychological level of 97.00, followed by 96.22, the lowest since February 2022, reached on September 17. Further declines would prompt the dollar index to test the lower boundary of the descending channel around 95.10.

The DXY may target its primary barrier at the nine-day EMA of 97.32. A break above this level would improve the short-term price momentum and support the dollar index to approach the descending channel’s upper boundary around the psychological level of 97.90, aligned with the 50-day EMA at 98.03.

US Dollar Index: Daily Chart

US Dollar Price Today

The table below shows the percentage change of US Dollar (USD) against listed major currencies today. US Dollar was the strongest against the New Zealand Dollar.

USD EUR GBP JPY CAD AUD NZD CHF
USD 0.03% 0.18% 0.06% 0.05% 0.19% 0.62% 0.10%
EUR -0.03% 0.02% 0.03% 0.04% 0.14% 0.69% 0.10%
GBP -0.18% -0.02% 0.02% 0.02% 0.11% 0.59% 0.08%
JPY -0.06% -0.03% -0.02% -0.00% 0.05% 0.52% 0.07%
CAD -0.05% -0.04% -0.02% 0.00% 0.12% 0.72% 0.06%
AUD -0.19% -0.14% -0.11% -0.05% -0.12% 0.57% -0.04%
NZD -0.62% -0.69% -0.59% -0.52% -0.72% -0.57% -0.49%
CHF -0.10% -0.10% -0.08% -0.07% -0.06% 0.04% 0.49%

The heat map shows percentage changes of major currencies against each other. The base currency is picked from the left column, while the quote currency is picked from the top row. For example, if you pick the US Dollar from the left column and move along the horizontal line to the Japanese Yen, the percentage change displayed in the box will represent USD (base)/JPY (quote).

Isenção de responsabilidade: Apenas para fins informativos. O desempenho passado não é indicativo de resultados futuros.
placeholder
O ouro está próximo de seu recorde histórico, com as apostas na redução das taxas do Fed mantendo o dólar americano em baixaO ouro (XAU/USD) recua ligeiramente após atingir um novo recorde, em torno da região de US$ 3.689-3.690 durante o pregão asiático desta terça-feira, em meio a algumas negociações de reposicionamento antes de eventos importantes dos bancos centrais.
Autor  FXStreet
9 Mês 16 Dia Ter
O ouro (XAU/USD) recua ligeiramente após atingir um novo recorde, em torno da região de US$ 3.689-3.690 durante o pregão asiático desta terça-feira, em meio a algumas negociações de reposicionamento antes de eventos importantes dos bancos centrais.
placeholder
TRBL11 projeta dividendos de até R$ 1,08; HGLG11 tem queda no lucro, mas mantém dividendo de R$ 1,10O fundo de investimento imobiliário Tellus Rio Bravo (TRBL11) divulgou seu relatório gerencial referente ao mês de agosto, informando um resultado total de R$ 2,335 milhões, o que equivale a R$ 0,30 por cota.
Autor  Pedro Augusto Prazeres
Ontem 01: 48
O fundo de investimento imobiliário Tellus Rio Bravo (TRBL11) divulgou seu relatório gerencial referente ao mês de agosto, informando um resultado total de R$ 2,335 milhões, o que equivale a R$ 0,30 por cota.
placeholder
Bitcoin (BTC) sobe para US$ 115 mil com força de derivativos, mas mercado à vista mostra fraquezaO preço do Bitcoin (BTC) subiu nesta sexta-feira (12), com um avanço de 1,5% nas últimas 24 horas que o levou a ser negociado novamente acima do importante patamar de US$ 115.000.
Autor  Pedro Augusto Prazeres
Ontem 01: 58
O preço do Bitcoin (BTC) subiu nesta sexta-feira (12), com um avanço de 1,5% nas últimas 24 horas que o levou a ser negociado novamente acima do importante patamar de US$ 115.000.
placeholder
Previsão do preço da Ethena: ENA sugere reversão de alta em meio à listagem na OKXO preço da Ethena (ENA) está sendo negociado abaixo do nível de US$ 0,7000 no momento da publicação desta notícia, na quarta-feira, prolongando a queda pelo quinto dia consecutivo. Ainda assim, as perspectivas técnicas e de derivativos apresentam uma possibilidade de reversão de alta em meio ao anúncio da OKX sobre a listagem da ENA na quarta-feira.
Autor  FXStreet
23 horas atrás
O preço da Ethena (ENA) está sendo negociado abaixo do nível de US$ 0,7000 no momento da publicação desta notícia, na quarta-feira, prolongando a queda pelo quinto dia consecutivo. Ainda assim, as perspectivas técnicas e de derivativos apresentam uma possibilidade de reversão de alta em meio ao anúncio da OKX sobre a listagem da ENA na quarta-feira.
placeholder
Ouro recua de máximos históricos com a recuperação do dólar americano antes da decisão do FedO ouro (XAU/USD) atrai alguns vendedores durante a sessão asiática desta quarta-feira e se afasta do pico histórico, com níveis ligeiramente acima da marca de US$ 3.700 atingida no dia anterior.
Autor  FXStreet
23 horas atrás
O ouro (XAU/USD) atrai alguns vendedores durante a sessão asiática desta quarta-feira e se afasta do pico histórico, com níveis ligeiramente acima da marca de US$ 3.700 atingida no dia anterior.
Produtos relacionados
goTop
quote