
Sui Price Forecast: SUI bulls target double-digit gains with $4.44 in sight
- Sui price hovers around $3.77 on Thursday after rebounding from a key support level earlier this week.
- On-chain data back a bullish outlook as DEX trading volume is rising with positive funding rates.
- The technical outlook suggests a rally continuation targeting $4.44 mark.
Sui (SUI) price trades in green, above $3.80 on Thursday after rebounding from its key support level earlier in the week. The bullish view is further supported by rising Decentralized Exchange (DEX) activity and favorable funding rates. The technical indicators project SUI for further upside, with bulls eyeing the $4.44 resistance level as the next major target.
Sui on-chain and derivatives show bullish sentiment
DeFiLlama data show that SUI’s decentralized exchange (DEX) trading volume rose from $552.91 million on Saturday to $561.63 million on Thursday, marking the highest volume in September and indicating growing trader interest and liquidity, which bolsters the platform’s bullish outlook.
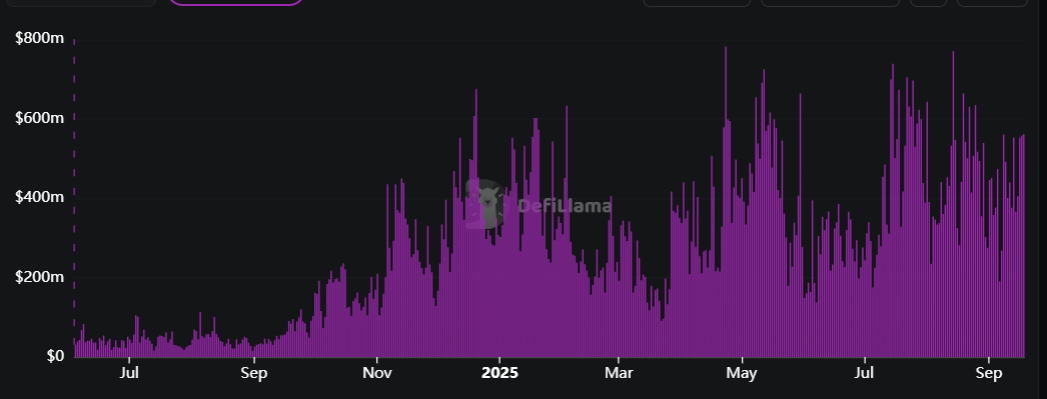
SUI DEX trading volume chart. Source: DefiLlama
Apart from rising trading volume, derivatives data also support a rally for Sui. Coinglass’s OI-Weighted Funding Rate data shows that the number of traders betting that the price of Sui will slide further is lower than those anticipating a price increase.
The metric is rising positively and stands at 0.0091% on Thursday, indicating that longs are outperforming shorts and supporting the bullish sentiment.
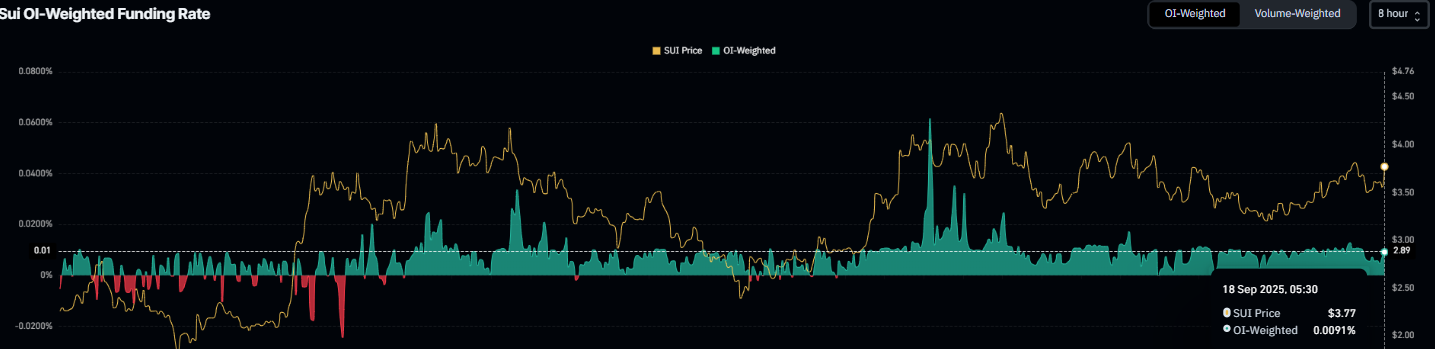
Sui funding rate chart. Source: Coinglass
Sui Price Forecast: Bulls aiming for 16% gains
Sui price broke above the falling wedge pattern on September 10 and rallied nearly 10% by Saturday. However, on Sunday, SUI failed to maintain the upward momentum and corrected 7.83% until the next day. On Tuesday, SUI retested and found support around the 50-day Exponential Moving Average (EMA) at $3.55 and rose 4.76% the next day. At the time of writing on Thursday, SUI continues to trade at a higher level around $3.82.
If SUI continues its upward momentum, it could extend the rally by 16% from its current level to reach its July 28 high at $4.44.
The Relative Strength Index (RSI) on the daily chart reads 59, above its neutral level of 50, and points upward, indicating that bullish momentum is gaining traction. The Moving Average Convergence (MACD) indicator on the same chart displayed a bullish crossover on September 7, which remains in effect, indicating sustained bullish momentum and an upward trend ahead.

SUI/USDT daily chart
However, if SUI faces a correction, it could extend the decline toward its 50-day EMA at $3.55.
Artigos Recomendados


