


WTI Oil retreats to $76 on low demand and trimmed positioning
- WTI Oil tests at an important level to more downturn.
- Oil traders are seeing limited upside with US stockpile build up and tepid outlook.
- The US Dollar Index is giving up on 104.00 with pressure building on the Greenback ahead of PCE data.
Oil prices are down nearly 1% in Monday’s trading with traders bracing for an eventful week when it comes to US data. On the Oil front markets will be on the lookout for any comments from key people in the Oil and broader energy complex with a big energy summit taking place this week in London. In addition, Goldman Sachs came out with a price target for Brent at $87 per barrel, which is roughly 9% below where it is trading at the moment.
Meanwhile, the US Dollar Index (DXY) is weakening a touch as well this Monday, ahead of the US data releases later this week. With the second reading of the US Gross Domestic Product (GDP) and the Personal Consumption Expenditures (PCE), markets will be able to reassess if the disinflationary path is back on track after the hiccup two weeks ago with that red hot Consumer Price Index (CPI) print. Expect a nervous US Dollar,therefore, this week which could move substantially on the back on any upbeat or downbeat surprise in the numbers.
Crude Oil (WTI) trades at $75.99 per barrel, and Brent Oil trades at $80.38 per barrel at the time of writing.
Oil news and market movers: All eyes on London this week
- The London Energy Forum 2024 Summit will take place on Monday and Tuesday this week, an event that usually brings market-moving headlines from big industry leaders. The event will continue with the International Energy Week from Tuesday to Friday.
- Goldman Sachs has revised its price target for Brent crude to $87 per barrel. That means a near 9% premium is still up for grabs in Brent Crude prices. The Goldman Sachs report had a few key takeaways:
- Geopolitical premium to remain modest.
- Surplus capacity among OPEC means limited upside.
- Prices set to spike in the summer with the Red Sea disruptions putting pressure on stockpiles during that time.
- Chinese Oil markets are starting to brighten up with a travel boom raising expectations for a pickup in demand for Oil and distillates.
Oil Technical Analysis: Risk of re-entry
Oil prices are on the decline this Monday, continuing the sell-off from last week which erased all earlier gains. With the technical snap below the 100-day Simple Moving Average (SMA) at $76.46, the outlook for this week looks bleak. The Goldman Sachs report does not help much, despite its higher price tags for Brent, the issues outlined in the report clearly state that Oil is in no shape to soon return to $80 or higher.
Oil bulls will have a lot to deal with on the upside. First, as mentioned above, the 100-day SMA is now acting as resistance near $76.46. Further up, the chopped-up 200-day SMA at $77.62 is still worth mentioning. From there, the heavily watched $79.66, ahead of $80.00, will be a heavily fought barrier, possibly not able to crack without a substantial catalyst.
On the downside, the pivotal level near $75.27 is the first element worth mentioning. In case that does not hold, downside levels to look for are $74.26 (55-day SMA) and the ascending green trend line again near $72.93 which should act as support. That means a re-entry into the Symmetrical Triangle which has been respected since the start of 2024.
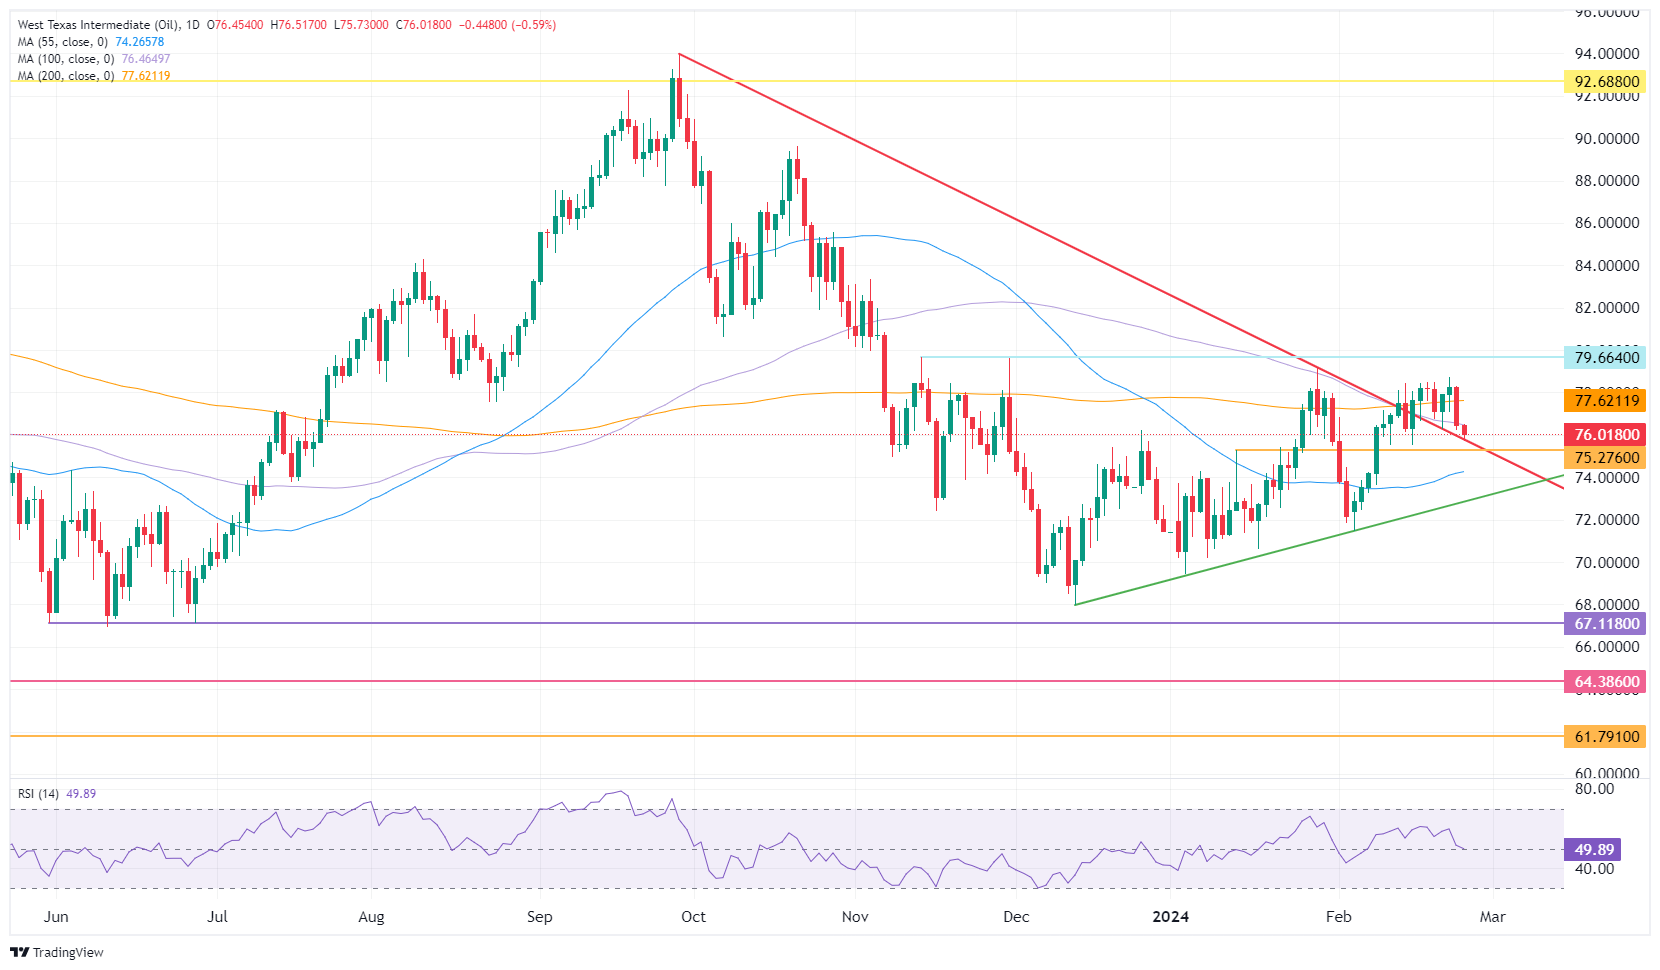
US WTI Crude Oil: Daily Chart
WTI Oil FAQs
What is WTI Oil?
WTI Oil is a type of Crude Oil sold on international markets. The WTI stands for West Texas Intermediate, one of three major types including Brent and Dubai Crude. WTI is also referred to as “light” and “sweet” because of its relatively low gravity and sulfur content respectively. It is considered a high quality Oil that is easily refined. It is sourced in the United States and distributed via the Cushing hub, which is considered “The Pipeline Crossroads of the World”. It is a benchmark for the Oil market and WTI price is frequently quoted in the media.
What factors drive the price of WTI Oil?
Like all assets, supply and demand are the key drivers of WTI Oil price. As such, global growth can be a driver of increased demand and vice versa for weak global growth. Political instability, wars, and sanctions can disrupt supply and impact prices. The decisions of OPEC, a group of major Oil-producing countries, is another key driver of price. The value of the US Dollar influences the price of WTI Crude Oil, since Oil is predominantly traded in US Dollars, thus a weaker US Dollar can make Oil more affordable and vice versa.
How does inventory data impact the price of WTI Oil
The weekly Oil inventory reports published by the American Petroleum Institute (API) and the Energy Information Agency (EIA) impact the price of WTI Oil. Changes in inventories reflect fluctuating supply and demand. If the data shows a drop in inventories it can indicate increased demand, pushing up Oil price. Higher inventories can reflect increased supply, pushing down prices. API’s report is published every Tuesday and EIA’s the day after. Their results are usually similar, falling within 1% of each other 75% of the time. The EIA data is considered more reliable, since it is a government agency.
How does OPEC influence the price of WTI Oil?
OPEC (Organization of the Petroleum Exporting Countries) is a group of 13 Oil-producing nations who collectively decide production quotas for member countries at twice-yearly meetings. Their decisions often impact WTI Oil prices. When OPEC decides to lower quotas, it can tighten supply, pushing up Oil prices. When OPEC increases production, it has the opposite effect. OPEC+ refers to an expanded group that includes ten extra non-OPEC members, the most notable of which is Russia.
Artigos Recomendados


