

Natural Gas keeps sinking despite rising tensions in Middle East
- Natural Gas snaps below recent multi-year low and prints new three-year low.
- Traders are sending Gas lower on tepid demand outweighing rising tensions.
- The US Dollar Index is flat above pivotal support with the US closed for holiday.
Natural Gas (XNG/USD) is trading around $1.63 and is unable to flare up after Iran accused Israel for blowing up one of its key vital Gas pipelines last week. The New York Times reported that Iran had proof of Israel being behind the attack. Meanwhile Israel itself is ramping up pressure on Gaza and Hamas by issuing a demand to give up the last hostages before the Shabbat in two weeks, or another massive ground offensive will be rolled out.
The US Dollar (USD) meanwhile is trading steady at a pivotal support level in the US Dollar Index (DXY). With US traders not in the market this Monday due to President’s Day, it looks like low volumes will be unable to really move the needle here. Traders will rather focus on the publication of the Minutes from the US Federal Reserve’s January meeting on Wednesday, and several US Purchase Manger’s Indices on Thursday which could make some moves for the Greenback.
Natural Gas is trading at $1.63 per MMBtu at the time of writing.
Natural Gas market movers: Tensions overshadowed by tepid demand
- Qatar is set to announce a string of substantial LNG deals with both Europe and Asia, Al-Kaabi confirms.
- Korea Gas, South-Korea’s biggest LNG group, agreed to extend its long term LNG contracts with Oman for another 10 years.
- Elevated temperatures are seen in Europe for the rest of the month, and will cut demand for Gas further in the region, below average demand for this time of year.
Natural Gas Technical Analysis: Demand remains key
Natural Gas keeps struggling to find a floor amidst the more and more tepid demand globally. Under normal circumstances, recent headlines out of Israel and Iran would have been enough to send Gas prices soaring. Though, even with these possible hiccups in Gas supply, Europe has no need for them which means there is still a supply surplus in the Gas market with traders looking for the right fair value amidst all of this.
On the upside, Natural Gas is facing some pivotal technical levels to get back to. First stop is $1.99, – the level which, when broken, saw an accelerated decline. Next is the blue line at $2.13 with the triple bottoms from 2023. In case Natural Gas sees sudden demand pick up, possibly $2.40 could come into play.
Keep an eye on $1.80, which was a pivotal level back in July 2020 and should act as a cap now. Should more supply emerge in the markets, or more weakening data globally point to even more sluggish global growth – $1.64 and $1.53 (the low of 2020) are targets to look out for.
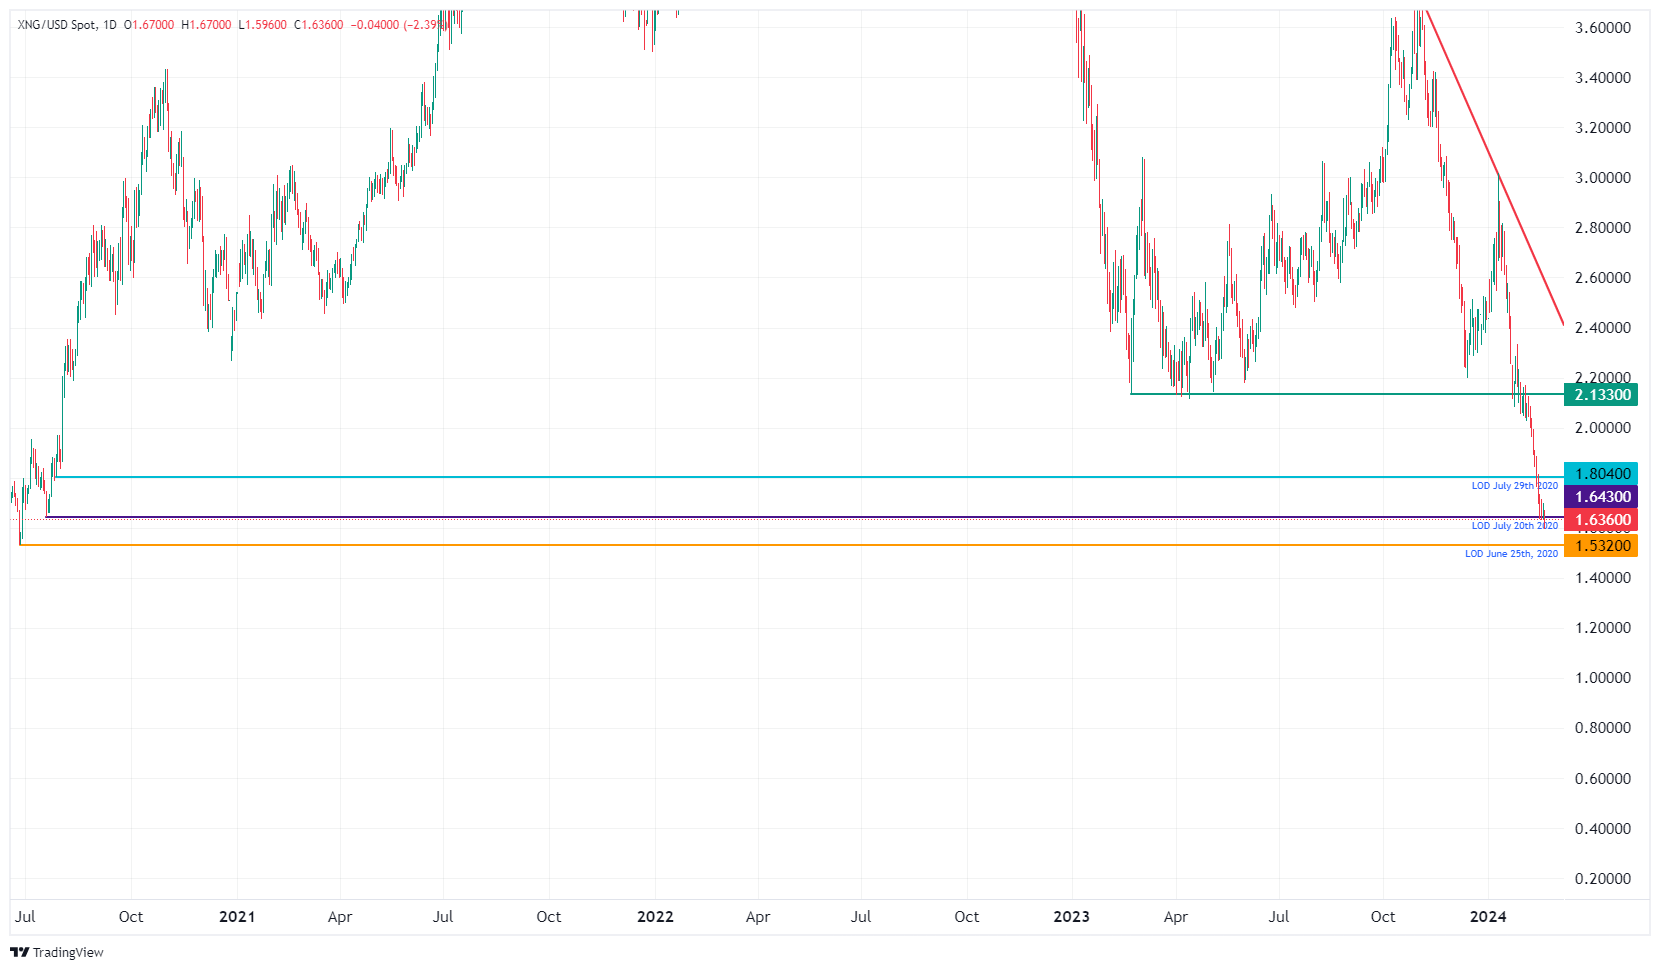
XNG/USD (Daily Chart)
Natural Gas FAQs
What fundamental factors drive the price of Natural Gas?
Supply and demand dynamics are a key factor influencing Natural Gas prices, and are themselves influenced by global economic growth, industrial activity, population growth, production levels, and inventories. The weather impacts Natural Gas prices because more Gas is used during cold winters and hot summers for heating and cooling. Competition from other energy sources impacts prices as consumers may switch to cheaper sources. Geopolitical events are factors as exemplified by the war in Ukraine. Government policies relating to extraction, transportation, and environmental issues also impact prices.
What are the main macroeconomic releases that impact on Natural Gas Prices?
The main economic release influencing Natural Gas prices is the weekly inventory bulletin from the Energy Information Administration (EIA), a US government agency that produces US gas market data. The EIA Gas bulletin usually comes out on Thursday at 14:30 GMT, a day after the EIA publishes its weekly Oil bulletin. Economic data from large consumers of Natural Gas can impact supply and demand, the largest of which include China, Germany and Japan. Natural Gas is primarily priced and traded in US Dollars, thus economic releases impacting the US Dollar are also factors.
How does the US Dollar influence Natural Gas prices?
The US Dollar is the world’s reserve currency and most commodities, including Natural Gas are priced and traded on international markets in US Dollars. As such, the value of the US Dollar is a factor in the price of Natural Gas, because if the Dollar strengthens it means less Dollars are required to buy the same volume of Gas (the price falls), and vice versa if USD strengthens.
Artigos Recomendados


