


Gold slightly recovers after gradual tariff plans leaked
- Gold price halts Monday’s decline and ties up again with gains on Tuesday.
- Sources in the Trump administration disclosed that a gradual tariff introduction is being considered to avoid an inflation shock.
- Gold is testing the upside barrier in a broader-term pennant formation.
Gold’s price (XAU/USD) halts its poor Monday performance when Federal Reserve (Fed) policy rate concerns took over sentiment, recovering slightly and trading near $2,670 at the time of writing on Tuesday. That sentiment is now changing again into a sigh of relief on headlines that the President-elect Donald Trump administration is considering a very gradual implementation of its tariff plans. Sources close to the matter disclosed that the Trump administration is very much concerned about an inflation shock and wants to avoid it at all costs.
On the economic data front, some cautionary warnings need to be issued. In the runup to the US Consumer Price Index (CPI) on Wednesday, the Producer Price Index (PPI) will be released this Tuesday. Traders will need to watch out for some knee-jerk reactions in yields, as a surprise upside beat in PPI numbers could spill over into expectations for a hot CPI release.
A hot PPI and CPI print would cause US yields to surge again and offset the reaction seen this Tuesday on the gradual tariff implementation news. For the Fed policy rate projections, this would mean the chances of any rate cut in 2025 would diminish further and might even head to nil.
Daily digest market movers: Trump administration is worried
- Sources at President-elect Donald Trump’s administration are discussing slowly ramping up tariffs in a gradual approach trying to avoid a spike in inflation, according to people familiar with the matter, Bloomberg reports.
- The US 10-year benchmark rate falls to 4.753% at the time of writing on Tuesday, fading from its fresh 14-month high of 4.802% seen on Monday.
- The CME (Chicago Mercantile Exchange) Fedwatch tool currently shows that the Federal Reserve will keep rate expectations steady until its meeting on June 18, when odds of keeping rates unchanged at current levels stand at 47.2%, compared to 52.8% for lower rates.
- The Commodity Futures Trading Commission (CFTC) released the Gold NC Net Positions on Monday. The current position came in positive at $254,900, compared to the previous at $247,300. This means a surge in long-positioning from speculative traders. The report provides information on the size and direction of the positions taken across all maturities, participants primarily based in Chicago and New York futures markets. Forex traders focus on "non-commercial" or speculative positions to determine whether a trend remains healthy or not, as well as market sentiment towards a certain asset.
Technical Analysis: Risk of slipping away
Gold has slipped back into the broader pennant chart formation in which it has been trading since November. The risk now is that the upside pennant border becomes a resistance again. A firm rejection from here could set off another downward move, towards $2,650 and lower.
On the downside, the 55-day Simple Moving Average (SMA) at $2,650 is the first support. Further down, the 100-day SMA at $2,635 is the next in line. Ultimately, the ascending trend line at the lower boundary of the pennant should contain the price action from falling, standing at $2,615 for now.
On the upside, the October 23 low at $2,708 is the next pivotal level to look out for. Once that level is cleared, though still quite far off, the all-time high of $2,790 is the key upside level.
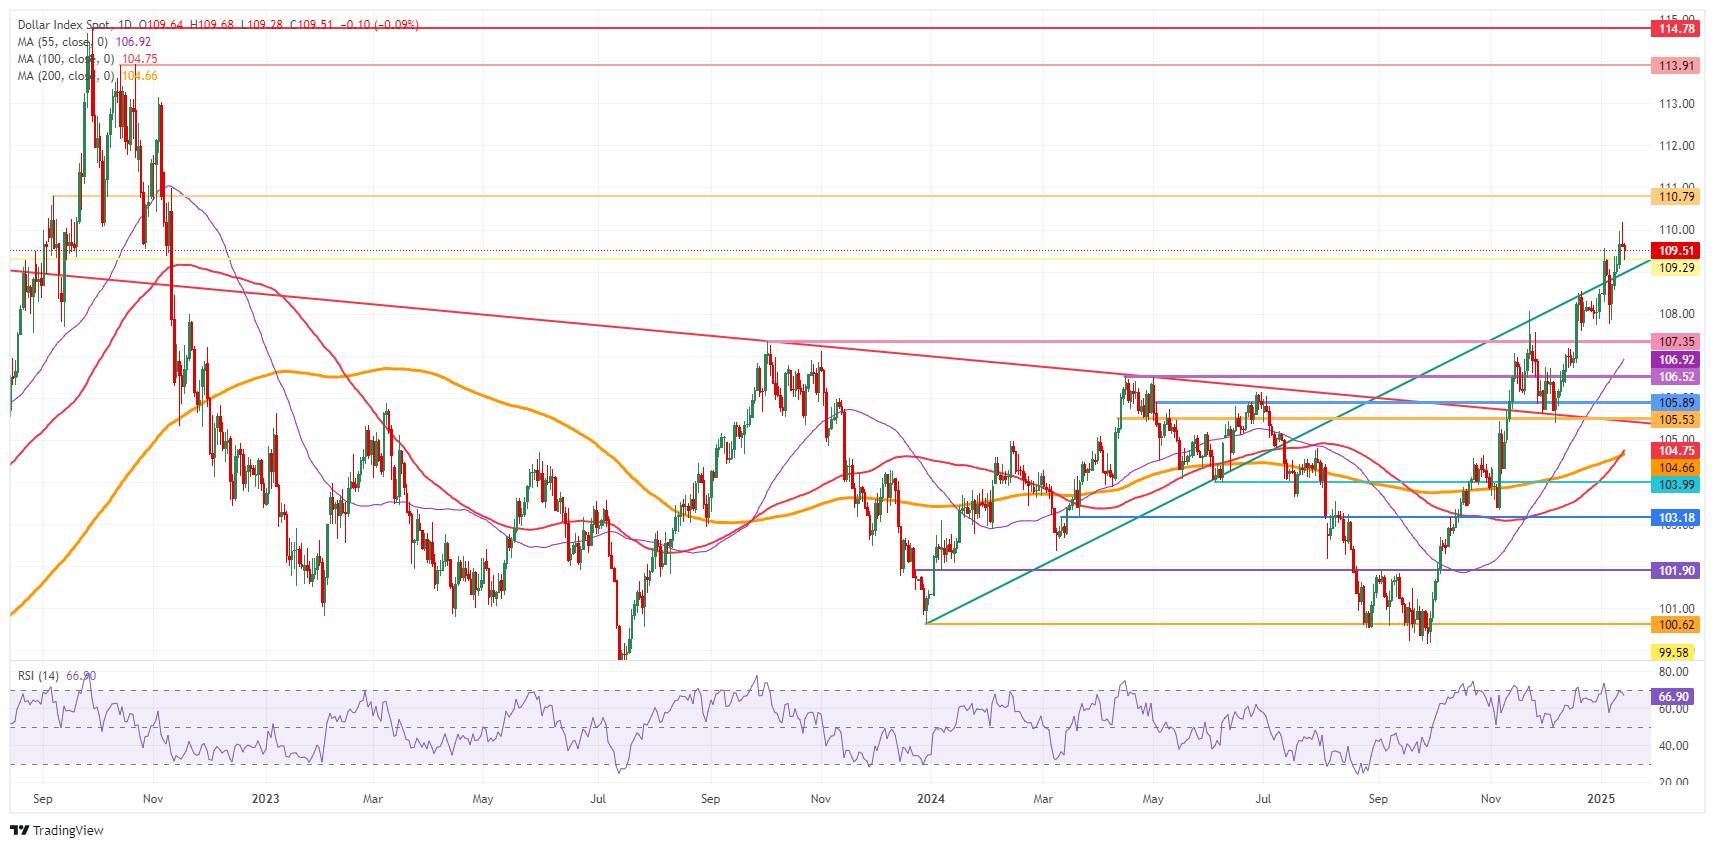
XAU/USD: Daily Chart
US Dollar FAQs
The US Dollar (USD) is the official currency of the United States of America, and the ‘de facto’ currency of a significant number of other countries where it is found in circulation alongside local notes. It is the most heavily traded currency in the world, accounting for over 88% of all global foreign exchange turnover, or an average of $6.6 trillion in transactions per day, according to data from 2022. Following the second world war, the USD took over from the British Pound as the world’s reserve currency. For most of its history, the US Dollar was backed by Gold, until the Bretton Woods Agreement in 1971 when the Gold Standard went away.
The most important single factor impacting on the value of the US Dollar is monetary policy, which is shaped by the Federal Reserve (Fed). The Fed has two mandates: to achieve price stability (control inflation) and foster full employment. Its primary tool to achieve these two goals is by adjusting interest rates. When prices are rising too quickly and inflation is above the Fed’s 2% target, the Fed will raise rates, which helps the USD value. When inflation falls below 2% or the Unemployment Rate is too high, the Fed may lower interest rates, which weighs on the Greenback.
In extreme situations, the Federal Reserve can also print more Dollars and enact quantitative easing (QE). QE is the process by which the Fed substantially increases the flow of credit in a stuck financial system. It is a non-standard policy measure used when credit has dried up because banks will not lend to each other (out of the fear of counterparty default). It is a last resort when simply lowering interest rates is unlikely to achieve the necessary result. It was the Fed’s weapon of choice to combat the credit crunch that occurred during the Great Financial Crisis in 2008. It involves the Fed printing more Dollars and using them to buy US government bonds predominantly from financial institutions. QE usually leads to a weaker US Dollar.
Quantitative tightening (QT) is the reverse process whereby the Federal Reserve stops buying bonds from financial institutions and does not reinvest the principal from the bonds it holds maturing in new purchases. It is usually positive for the US Dollar.
Artigos Recomendados


