


USD/CAD churns on Wednesday ahead of Fed meeting Minutes
- USD/CAD tested a new high for the week but remains tepid.
- Canada’s New Housing Price Index declined slightly in January.
- Fed’s FOMC meeting Minutes to be the key release for Wednesday.
USD/CAD briefly tested a fresh high for the week, but the pair continues to churn in near-term consolidation levels as markets buckle down for the latest meeting Minutes from the Federal Reserve’s (Fed) Federal Open Market Committee (FOMC). Market momentum remains thin with US Purchasing Managers Index (PMI) figures due on Thursday, and the trading week will wrap up with the Fed’s latest Monetary Policy Report on Friday.
Canada saw its New Housing Price Index decline in January with the annualized figure softening at a slower rate than previous. Canadian Retail Sales are due on Thursday but are likely to be engulfed by the US PMI prints.
Daily digest market movers: USD/CAD cycles ahead of FOMC with key data around the corner
- Canada’s New Housing Price Index declined 0.1% in January MoM versus the previous flat print of 0.0%.
- The YoY figure fell 0.7%, less than the previous print of -0.9%.
- The FOMC’s latest meeting Minutes will draw plenty of scrutiny as money markets size up a June rate cut from the Fed.
- Fed Minutes Preview: Investors to scrutinize discussions as markets lean toward June for rate cuts
- Meanwhile, Richmond Fed President Thomas Barkin hit newswires, noting that while the US is on the “back end” of its inflation problem, there’s still further to go.
- Barkin also noted that much of the current declines in inflation have been centered around goods, with services prices remaining problematic for the Fed’s inflation targets.
- Fed's Barkin: Still ways to go to get to a soft landing
- Canada’s Retail Sales due on Thursday are expected to rebound with December’s MoM Retail Sales forecast to print at 0.8% versus the previous print of -0.2%.
- The US’ S&P Global Manufacturing PMI for February, also slated for Thursday, is expected to tick down to 50.5 from 50.7.
Canadian Dollar price today
The table below shows the percentage change of Canadian Dollar (CAD) against listed major currencies today. Canadian Dollar was the weakest against the Swiss Franc.
| USD | EUR | GBP | CAD | AUD | JPY | NZD | CHF | |
| USD | -0.03% | 0.00% | -0.11% | 0.14% | 0.20% | -0.10% | -0.22% | |
| EUR | 0.04% | 0.04% | -0.06% | 0.18% | 0.23% | -0.06% | -0.18% | |
| GBP | 0.00% | -0.04% | -0.11% | 0.13% | 0.21% | -0.10% | -0.21% | |
| CAD | 0.11% | 0.06% | 0.10% | 0.24% | 0.30% | 0.00% | -0.11% | |
| AUD | -0.13% | -0.22% | -0.14% | -0.25% | 0.06% | -0.24% | -0.36% | |
| JPY | -0.21% | -0.23% | -0.19% | -0.32% | -0.07% | -0.30% | -0.38% | |
| NZD | 0.10% | 0.06% | 0.10% | -0.01% | 0.23% | 0.30% | -0.12% | |
| CHF | 0.21% | 0.18% | 0.22% | 0.11% | 0.36% | 0.41% | 0.12% |
The heat map shows percentage changes of major currencies against each other. The base currency is picked from the left column, while the quote currency is picked from the top row. For example, if you pick the Euro from the left column and move along the horizontal line to the Japanese Yen, the percentage change displayed in the box will represent EUR (base)/JPY (quote).
Technical analysis: USD/CAD adrift just north of 1.3500
USD/CAD found a little extra room on the high side early Wednesday, touching a new high for the trading week, but the pair remains firmly embedded in near-term technical congestion. The USD/CAD is sticking close to the 1.3500 handle as markets await a firm push in either direction.
The pair finally finished closing last week’s Fair Value Gap (FVG) at 1.3530. The USD/CAD sees a heavy support zone between 1.3480 and 1.3470, just above last week’s Order Block (OB) near 1.3460. Technicals favor a continued bullish break of character, but only if the pair is able to build enough momentum to return to last week’s peak bids near 1.3585.
Daily candles see the USD/CAD continuing to struggle near the 200-day Simple Moving Average (SMA) at 1.3478, but a pattern of higher lows supports a thin push into the bullish side. The USD/CAD is up 2.5% from the last swing low into the 1.3200 handle but still has a ways to go on the high side, still down nearly 3% from last November’s peak near 1.3900.
USD/CAD hourly chart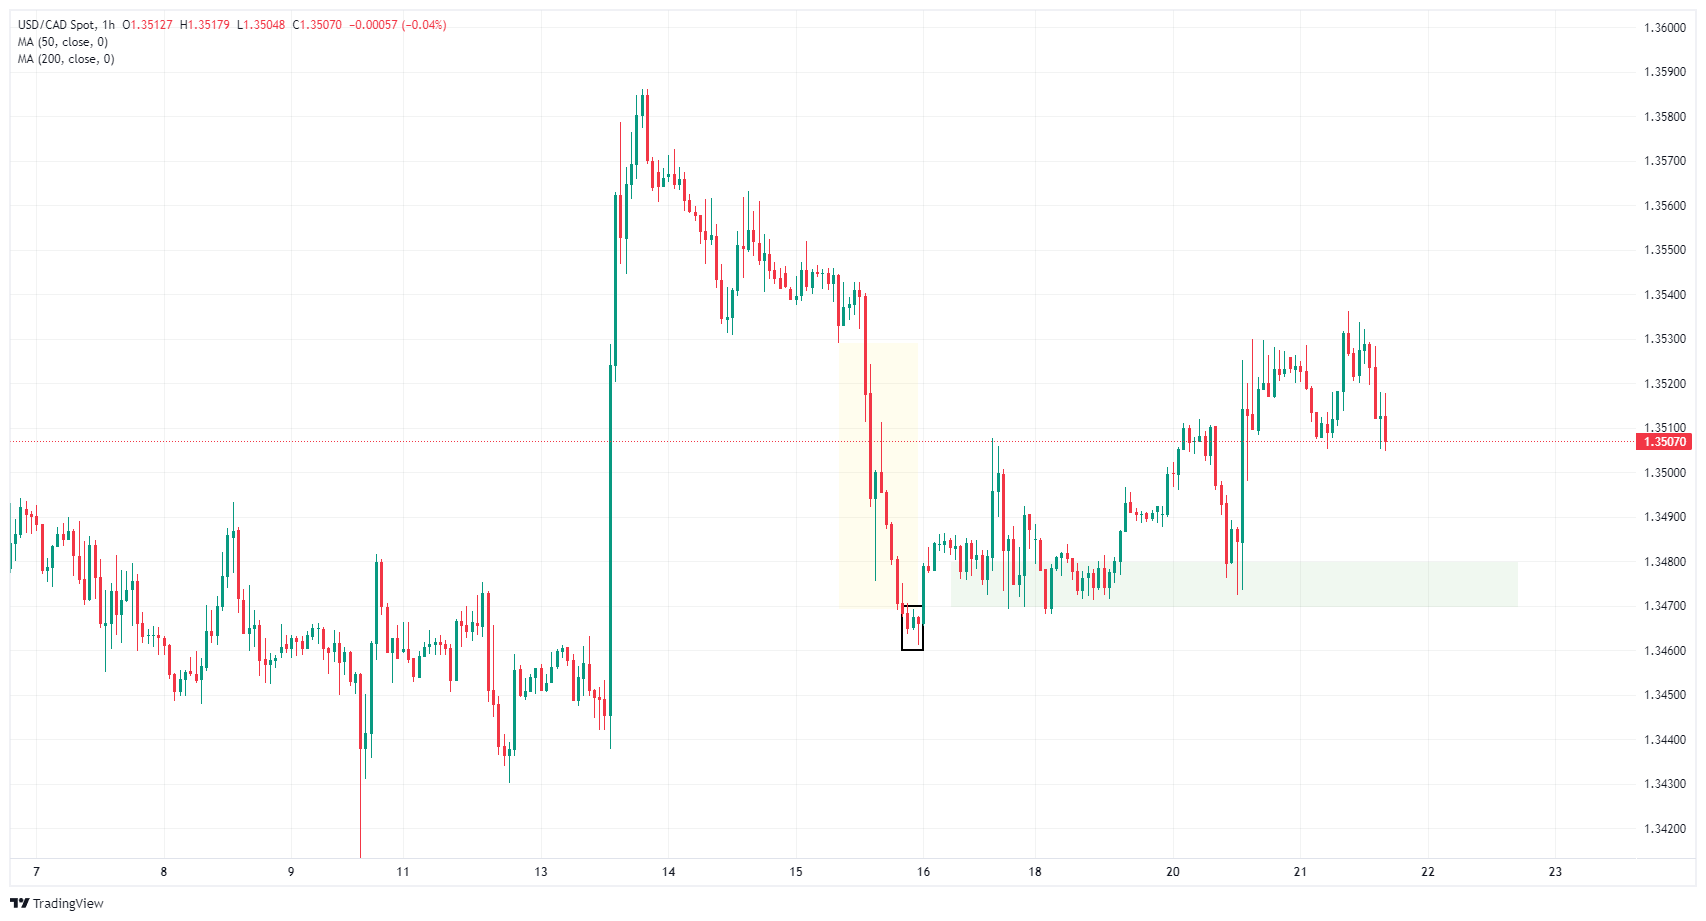
USD/CAD daily chart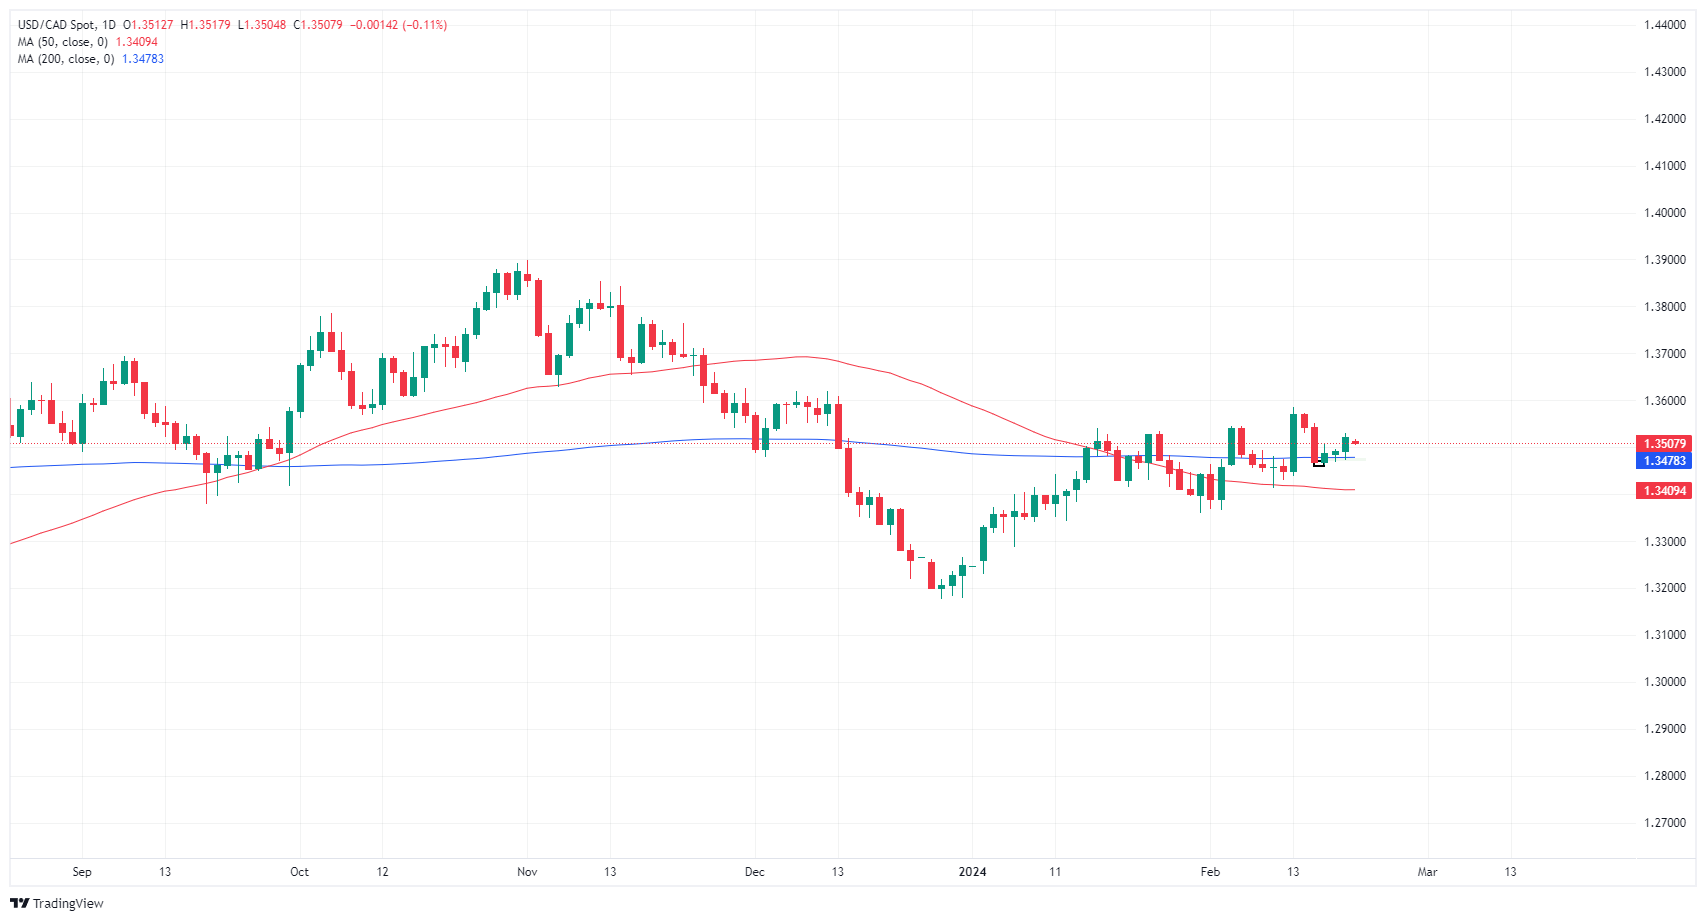
Canadian Dollar FAQs
What key factors drive the Canadian Dollar?
The key factors driving the Canadian Dollar (CAD) are the level of interest rates set by the Bank of Canada (BoC), the price of Oil, Canada’s largest export, the health of its economy, inflation and the Trade Balance, which is the difference between the value of Canada’s exports versus its imports. Other factors include market sentiment – whether investors are taking on more risky assets (risk-on) or seeking safe-havens (risk-off) – with risk-on being CAD-positive. As its largest trading partner, the health of the US economy is also a key factor influencing the Canadian Dollar.
How do the decisions of the Bank of Canada impact the Canadian Dollar?
The Bank of Canada (BoC) has a significant influence on the Canadian Dollar by setting the level of interest rates that banks can lend to one another. This influences the level of interest rates for everyone. The main goal of the BoC is to maintain inflation at 1-3% by adjusting interest rates up or down. Relatively higher interest rates tend to be positive for the CAD. The Bank of Canada can also use quantitative easing and tightening to influence credit conditions, with the former CAD-negative and the latter CAD-positive.
How does the price of Oil impact the Canadian Dollar?
The price of Oil is a key factor impacting the value of the Canadian Dollar. Petroleum is Canada’s biggest export, so Oil price tends to have an immediate impact on the CAD value. Generally, if Oil price rises CAD also goes up, as aggregate demand for the currency increases. The opposite is the case if the price of Oil falls. Higher Oil prices also tend to result in a greater likelihood of a positive Trade Balance, which is also supportive of the CAD.
How does inflation data impact the value of the Canadian Dollar?
While inflation had always traditionally been thought of as a negative factor for a currency since it lowers the value of money, the opposite has actually been the case in modern times with the relaxation of cross-border capital controls. Higher inflation tends to lead central banks to put up interest rates which attracts more capital inflows from global investors seeking a lucrative place to keep their money. This increases demand for the local currency, which in Canada’s case is the Canadian Dollar.
How does economic data influence the value of the Canadian Dollar?
Macroeconomic data releases gauge the health of the economy and can have an impact on the Canadian Dollar. Indicators such as GDP, Manufacturing and Services PMIs, employment, and consumer sentiment surveys can all influence the direction of the CAD. A strong economy is good for the Canadian Dollar. Not only does it attract more foreign investment but it may encourage the Bank of Canada to put up interest rates, leading to a stronger currency. If economic data is weak, however, the CAD is likely to fall.
Artigos Recomendados


