


GBP/USD tumbles through 1.27 on Thursday
- GBP/USD backslid yet again on Thursday, falling to a 19-week low.
- Cable is on pace for its single worst week since mid-2023.
- GBP bidders will be waiting for Friday’s UK GDP print.
GBP/USD fell to a fresh 19-week low on Thursday, piercing the 1.2700 handle before finding near-term technical support from 1.2650. The Pound continues to ease with a lack of meaningful faith behind it, while broader markets continue to bolster the Greenback higher across the board.
Producer Price Index (PPI) producer-level inflation figures came in roughly as expected, despite a slight upswing in annualized core PPI numbers. Headline PPI matched forecasts in October, rising 0.2% MoM compared to the previous month’s revised 0.1%. Core PPI for the year ended in October accelerated more than expected, ticking up to 3.1% compared to the expected 3.0% rising above the previous period’s 2.9%, which was also revised slightly higher from 2.8%.
Coming up on Friday, UK Gross Domestic Product (GDP) figures will give Cable bidders something to chew on, while Greenback buyers will be looking for a surprise improvement in US Retail Sales. UK GDP for the third quarter is expected to sink to 0.2% QoQ from the previous quarter’s print ofg 0.5%. US Retail Sales are likewise forecast to ease slightly in October, expected to print at 0.3% MoM compared to September’s 0.4%.
GBP/USD price forecast
The GBP/USD daily chart shows a pronounced downtrend with significant bearish momentum. After a brief consolidation period around the 1.2900 level, the pair has broken below the 50-day and 200-day Exponential Moving Averages (EMAs), which were providing support near 1.2990 and 1.2865, respectively. This bearish cross between the 50-day EMA (blue line) and the 200-day EMA (black line) is a strong sell signal, commonly known as a "death cross," suggesting further downside potential. The recent break below these key moving averages reinforces the likelihood of continued downward pressure, with the next significant support zone around 1.2600.
The MACD indicator also confirms the bearish bias, as the MACD line has crossed below the signal line in negative territory. This indicates a strong bearish trend with increasing downside momentum. The histogram bars are deepening below the zero line, suggesting that selling pressure remains strong and the pair may struggle to find support. If the bearish momentum persists, GBP/USD could extend its losses, potentially testing the psychological 1.2500 level. A break above the 1.2865 resistance (200-day EMA) would be required to alleviate some of the immediate downside pressure, though the bias remains bearish as long as price remains below the 50-day EMA.
GBP/USD daily chart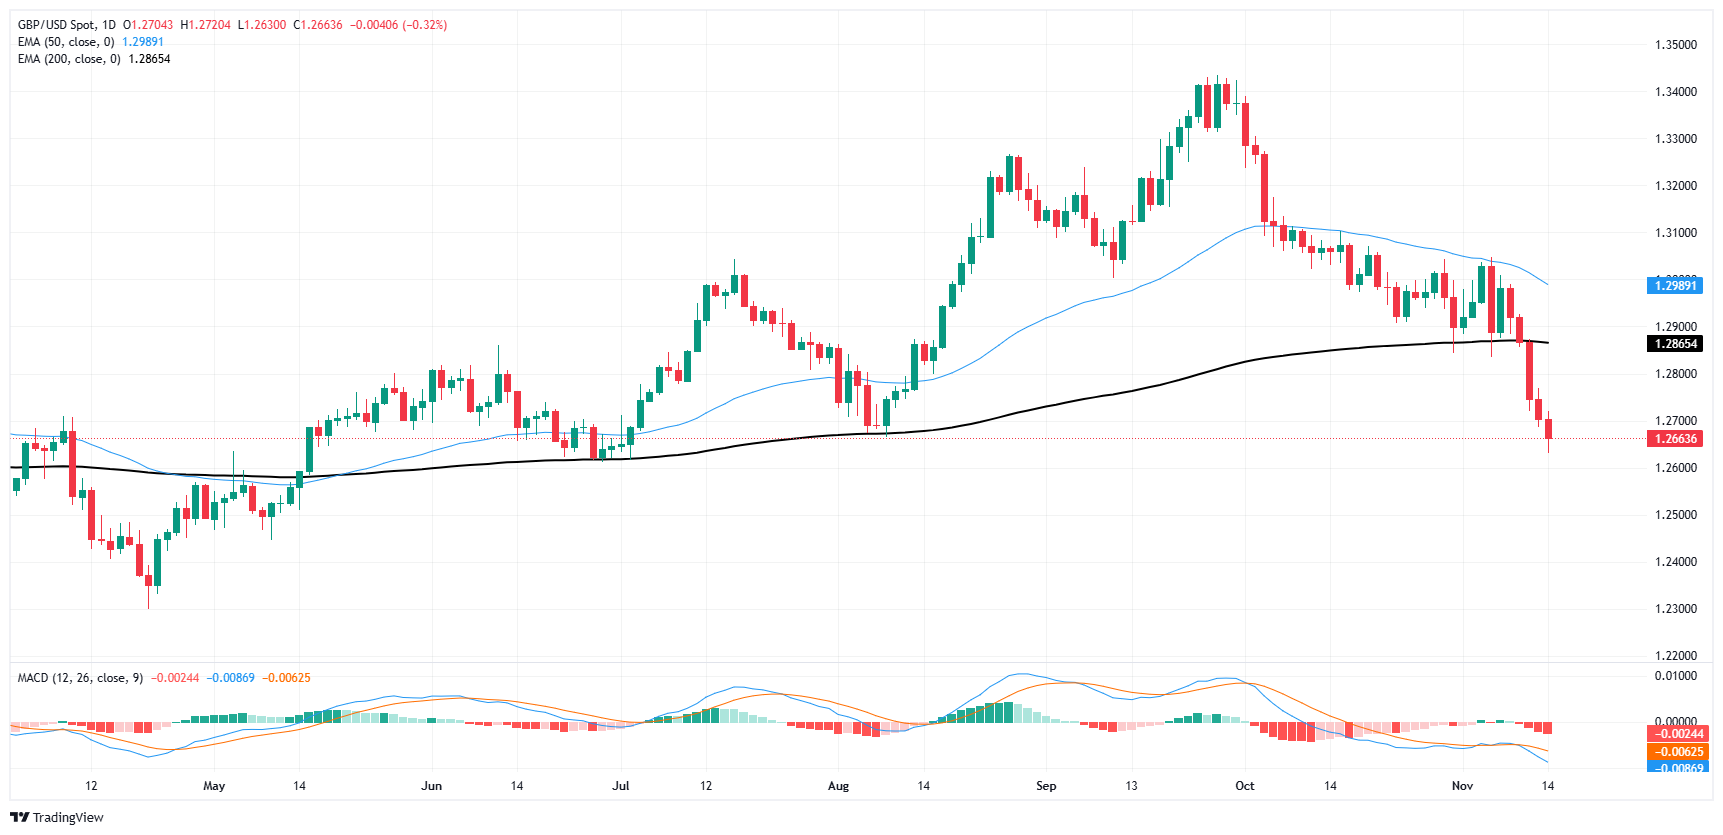
Pound Sterling FAQs
The Pound Sterling (GBP) is the oldest currency in the world (886 AD) and the official currency of the United Kingdom. It is the fourth most traded unit for foreign exchange (FX) in the world, accounting for 12% of all transactions, averaging $630 billion a day, according to 2022 data. Its key trading pairs are GBP/USD, also known as ‘Cable’, which accounts for 11% of FX, GBP/JPY, or the ‘Dragon’ as it is known by traders (3%), and EUR/GBP (2%). The Pound Sterling is issued by the Bank of England (BoE).
The single most important factor influencing the value of the Pound Sterling is monetary policy decided by the Bank of England. The BoE bases its decisions on whether it has achieved its primary goal of “price stability” – a steady inflation rate of around 2%. Its primary tool for achieving this is the adjustment of interest rates. When inflation is too high, the BoE will try to rein it in by raising interest rates, making it more expensive for people and businesses to access credit. This is generally positive for GBP, as higher interest rates make the UK a more attractive place for global investors to park their money. When inflation falls too low it is a sign economic growth is slowing. In this scenario, the BoE will consider lowering interest rates to cheapen credit so businesses will borrow more to invest in growth-generating projects.
Data releases gauge the health of the economy and can impact the value of the Pound Sterling. Indicators such as GDP, Manufacturing and Services PMIs, and employment can all influence the direction of the GBP. A strong economy is good for Sterling. Not only does it attract more foreign investment but it may encourage the BoE to put up interest rates, which will directly strengthen GBP. Otherwise, if economic data is weak, the Pound Sterling is likely to fall.
Another significant data release for the Pound Sterling is the Trade Balance. This indicator measures the difference between what a country earns from its exports and what it spends on imports over a given period. If a country produces highly sought-after exports, its currency will benefit purely from the extra demand created from foreign buyers seeking to purchase these goods. Therefore, a positive net Trade Balance strengthens a currency and vice versa for a negative balance.
Artigos Recomendados


