
Australian Dollar holds ground following China’s PMI data release
- Australian Dollar moves little as traders adopt caution ahead of the RBA's rate decision.
- China’s NBS Manufacturing PMI rose to 49.8, while Non-Manufacturing PMI inched lower to 50.0 in September.
- The US Dollar may face challenges as the government nears a funding freeze and possible shutdown.
The Australian Dollar (AUD) gains ground on Tuesday, with the AUD/USD pair extending its gains for the third successive session. The AUD remains stronger following the release of the NBS Purchasing Managers’ Index (PMI) data from China and Australia’s Building Permits. Traders await the Reserve Bank of Australia's (RBA) interest rate decision, due later in the day.
China’s NBS Manufacturing PMI improved to 49.8 in September, following August’s 49.4. The reading came in above the market consensus of 49.6 in the reported month. The NBS Non-Manufacturing PMI inched lower to 50.0 in September, from August’s 50.3 figure and missed the expectations of 50.3.
Australia’s Building Permits fell 6% month-over-month in August, following July’s 8.2% drop and surpassing the forecast decline of 5.5%.
Australian Dollar remains steady despite US Dollar correcting upwards
- The US Dollar Index (DXY), which measures the value of the US Dollar (USD) against six major currencies, is hovering around 98.00 at the time of writing. The Greenback may further weaken as traders tread cautiously amid concerns that the upcoming US jobs report may not be released this week, with the government nearing a funding freeze and possible shutdown.
- US President Donald Trump has warned of mass federal job cuts if Congress fails to pass a funding bill, effectively putting his own government at risk and threatening further disruptions to federal operations.
- The Greenback weakens after the US August inflation report boosted the likelihood that the US Federal Reserve (Fed) will likely deliver another interest rate cut in October. Markets are now pricing in nearly an 88% chance of a Fed rate cut in October and a 65% possibility of another reduction in December, according to the CME FedWatch Tool.
- The US Personal Consumption Expenditures (PCE) Price Index climbed 2.7% year-over-year in August, compared to 2.6% prior. This figure was in line with analyst forecasts. The core PCE, which excludes food and energy prices, came in at 2.9% YoY during the same period, also matching expectations.
- President Trump shared plans to impose a 100% tariff on imports of branded or patented pharmaceutical products from October 1, unless a pharmaceutical company is building a manufacturing plant in the US. Trump also unveiled tariffs of 50% on kitchen cabinets and bathroom vanities and 25% on trucks.
- The US Gross Domestic Product (GDP) Annualized grew 3.8% in the second quarter (Q2), coming in above the previous estimate and the estimation of 3.3%. Meanwhile, the GDP Price Index rose 2.1% in the same period, as compared to the expected and previous 2.0% growth.
- The White House announced that Australian Prime Minister Anthony Albanese and US President Donald Trump will hold their first in-person meeting in Washington, D.C. on October 20 to discuss the Aukus nuclear submarine pact.
- Australia posted a budget deficit of nearly A$10 billion (approximately $6.55 billion) for the year ending June 2025, marking the end of two consecutive years of surpluses. The shortfall was far smaller than the Treasury’s A$27.9 billion forecast.
- Australia’s Monthly Consumer Price Index (CPI), which climbed by 3.0% year-over-year in August, following a 2.8% increase reported in July. The ASX 30 Day Interbank Cash Rate Futures indicate that markets now price just a 4% chance of a September rate cut. According to Reuters, prospects for a Reserve Bank of Australia (RBA) rate reduction at its November meeting faded to 50% from almost 70% before the data.
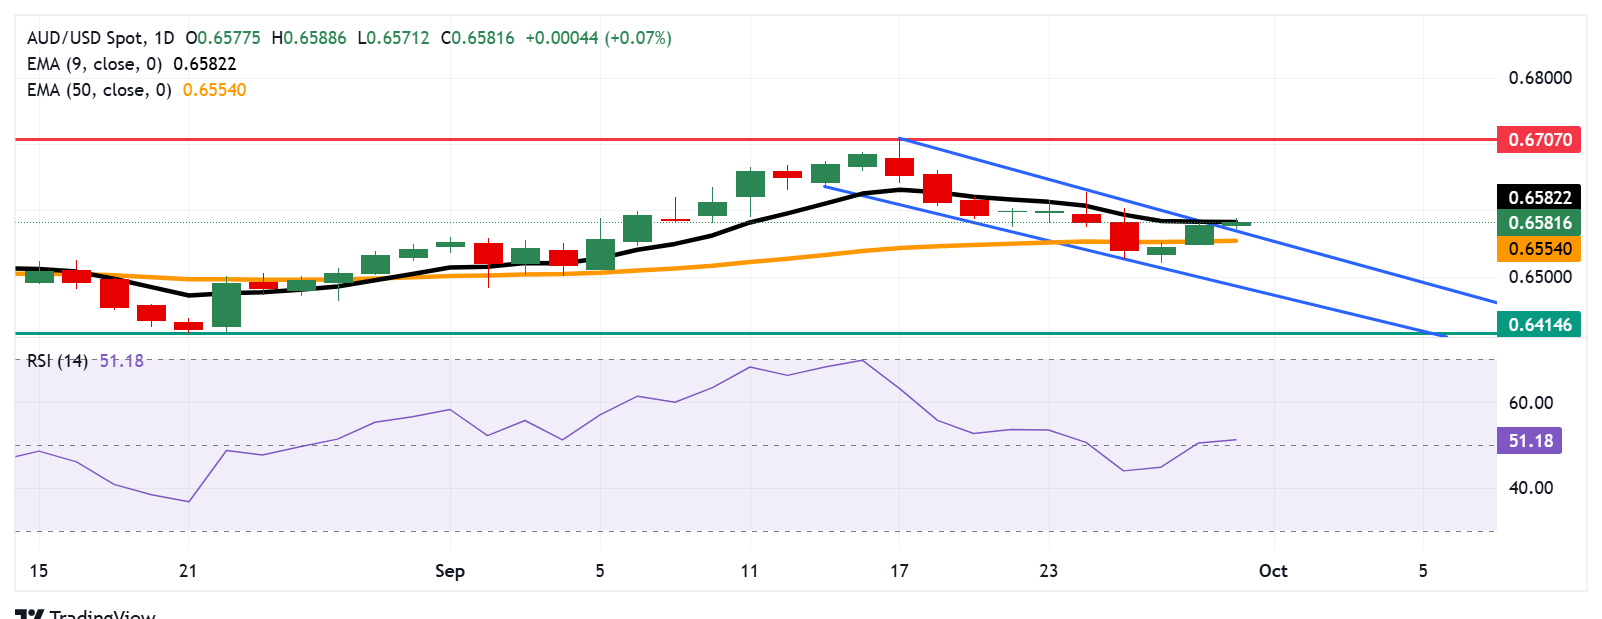
Australian Dollar tests nine-day EMA barrier near 0.6600
The AUD/USD pair is trading around 0.6580 on Tuesday. Technical analysis on the daily chart shows that the pair has breached above the descending channel pattern, indicating a market shift to bullish from bearish bias. Additionally, the 14-day Relative Strength Index (RSI) is positioned on the 50 level, indicating a neutral market sentiment. Further movements will likely offer a clear directional trend.
The initial resistance lies at the nine-day Exponential Moving Average (EMA) of 0.6582. A break above the level would improve the short-term price momentum and support the pair to explore the region around the 11-month high of 0.6707, recorded on September 17.
On the downside, the AUD/USD pair may retreat to the descending channel and find immediate support at the 50-day EMA at 0.6554. A break below this level would dampen the medium-term price momentum and prompt the pair to test the channel’s lower boundary around 0.6490.
AUD/USD: Daily Chart
Economic Indicator
NBS Manufacturing PMI
The NBS Manufacturing Purchasing Managers Index (PMI), released by the China Federation of Logistics & Purchasing (CFLP) and China’s National Bureau of Statistics (NBS), is a leading indicator gauging business activity in China’s manufacturing sector. The data is derived from surveys of senior executives at manufacturing companies. Survey responses reflect the change, if any, in the current month compared to the previous month and can anticipate changing trends in official data series such as Gross Domestic Product (GDP), industrial production, employment and inflation. The index varies between 0 and 100, with levels of 50.0 signaling no change over the previous month. A reading above 50 indicates that the manufacturing economy is generally expanding, a bullish sign for the Renminbi (CNY). Meanwhile, a reading below 50 signals that activity among goods producers is generally declining, which is seen as bearish for CNY.
Read more.Last release: Tue Sep 30, 2025 01:30
Frequency: Monthly
Actual: 49.8
Consensus: 49.6
Previous: 49.4
Source: China Federation of Logistics and Purchasing
The monthly manufacturing PMI is released by China Federation of Logistics and Purchasing (CFLP) on the last day of every month. The official PMI is released before the Caixin Manufacturing PMI, which makes it even more of a leading indicator, highlighting the health of the manufacturing sector, considered as the backbone of the Chinese economy. The data is of high relevance for the financial markets throughout several asset classes, given China’s influence on the global economy.
Artigos Recomendados


