
US yields climb on tepid CPI, traders dial back Fed cut bets
- April CPI softer than forecast; headline rises 0.2% MoM, core CPI steady at 2.8% YoY.
- Markets eye May CPI for tariff effects; real yields climb to 2.21%, weighing on Gold.
- Fed rate cut bets reduced to 52 bps from 76 bps after trade truce and firm inflation print.
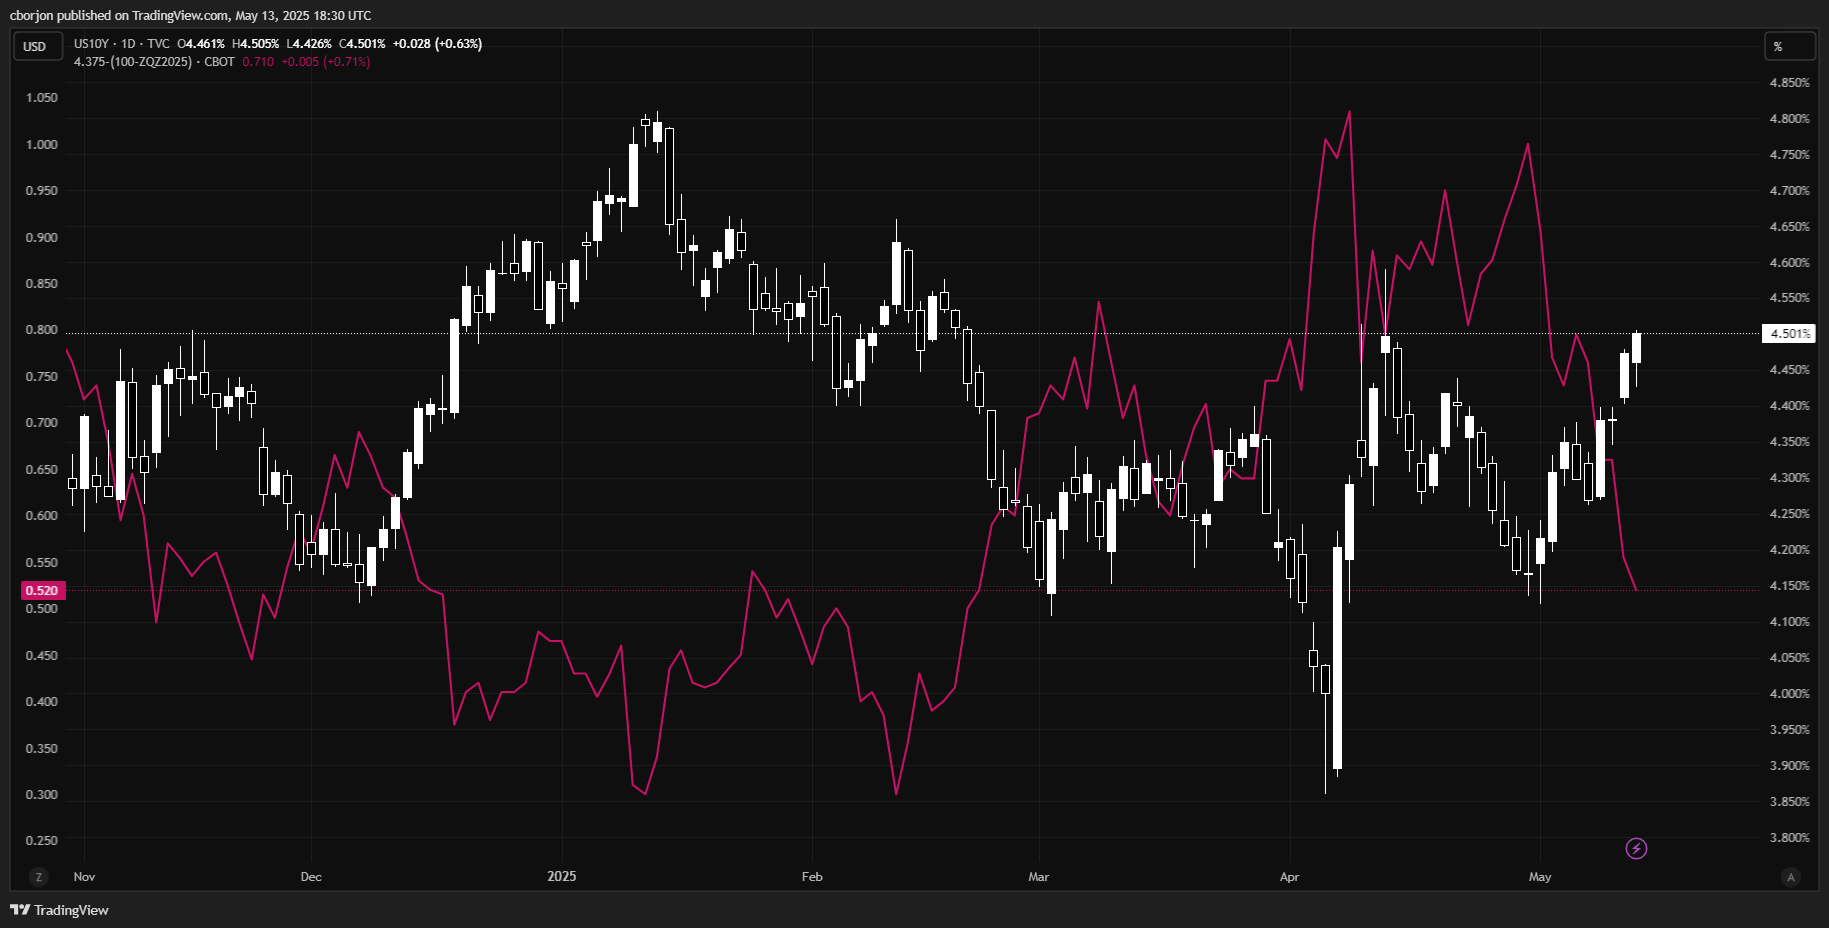
US Treasury yields rose across the entire yield curve on Tuesday after the latest US inflation report was surprisingly softer than expected, as investors had anticipated a slight uptick due to trade tariffs. At the time of writing, the US 10-year Treasury note yield had edged up more than two basis points to 4.495%.
10-year yield rises to 4.495% as markets eye inflation pipeline and real yields cap Gold's rebound
The release of April’s US Consumer Price Index (CPI) data kept US yields steady. However, there is an expectation that May figures will more likely reflect the impact of tariffs.
The US CPI rose by 0.2% MoM after sliding -0.1% in March, the first decline since May 2020. Expectations were that CPI would rise 0.3%. Every year, CPI increased 2.3%, down from estimates and March’s 2.4%.
Core CPI expanded 0.2% last month, up from 0.1% in the prior month. In the twelve months to April, core cPI increased 2.8%, unchanged from March’s numbers.
On Monday, US yields rose sharply as Washington and Beijing agreed on a 90-day pause in tariffs, with both countries, the US and China, reducing duties significantly. Washington tariffs on Chinese imports stand at 30%. Tariffs for Chinese imports of US products stand at 10%.
US real yields are also climbing, capping Gold’s advance
The US 10-year real yields, which are the difference of the US 10-year nominal yield minus inflation expectations for the same period, surge three basis points at 2.21%.
Traders priced out one interest rate cut by the Fed, as market participants expect only 52 basis points (bps) of easing, contrary to the 76-bps scheduled on May 7.
US 10-year Treasury yield chart / Fed interest rate probabilities
Interest rates FAQs
Interest rates are charged by financial institutions on loans to borrowers and are paid as interest to savers and depositors. They are influenced by base lending rates, which are set by central banks in response to changes in the economy. Central banks normally have a mandate to ensure price stability, which in most cases means targeting a core inflation rate of around 2%. If inflation falls below target the central bank may cut base lending rates, with a view to stimulating lending and boosting the economy. If inflation rises substantially above 2% it normally results in the central bank raising base lending rates in an attempt to lower inflation.
Higher interest rates generally help strengthen a country’s currency as they make it a more attractive place for global investors to park their money.
Higher interest rates overall weigh on the price of Gold because they increase the opportunity cost of holding Gold instead of investing in an interest-bearing asset or placing cash in the bank. If interest rates are high that usually pushes up the price of the US Dollar (USD), and since Gold is priced in Dollars, this has the effect of lowering the price of Gold.
The Fed funds rate is the overnight rate at which US banks lend to each other. It is the oft-quoted headline rate set by the Federal Reserve at its FOMC meetings. It is set as a range, for example 4.75%-5.00%, though the upper limit (in that case 5.00%) is the quoted figure. Market expectations for future Fed funds rate are tracked by the CME FedWatch tool, which shapes how many financial markets behave in anticipation of future Federal Reserve monetary policy decisions.
추천 기사


