


Bitcoin Price Forecast: BTC hovers around $95,000 as Trump hints at mixed signals on the economy, trade deals
- Bitcoin price hovers around $95,00 on Monday after falling nearly 3% over the weekend.
- President Trump acknowledged a possible recession but aims to announce at least one trade deal this week, the Wall Street Journal reports.
- On-chain data shows that BTC holders are realizing profits, increasing the downward pressure on price.
Bitcoin (BTC) price is hovering around $95,000 at the time of writing on Monday after facing a pullback of nearly 3% over the weekend. US President Donald Trump acknowledged a possible recession but aims to announce at least one trade deal this week, the Wall Street Journal reports. On-chain data shows that BTC holders are realizing profits, increasing the downward pressure on price.
Mixed signals on the economy, trade deals raise risk-off sentiment
A Wall Street Journal (WSJ) report on Sunday said President Trump is downplaying concerns about a potential economic downturn while pursuing aggressive trade and fiscal policies.
The report explains that, according to a senior administration official, the White House aims to announce at least one deal with a country seeking to escape higher tariffs in the coming week.
Despite internal and external criticism from Warren Buffett, Trump continues to use tariffs as leverage to boost domestic manufacturing. The legendary investor and chairperson of Berkshire Hathaway, breaking his tariff silence, criticized protectionist policies over the weekend.
“Trade should not be a weapon,” Buffett said at Berkshire Hathaway’s annual meeting.
Meanwhile, Congress is working on a tax-and-spending bill that could offer some stability, though tensions with China and uncertain economic signals remain. Moreover, in an interview that aired Sunday, Trump acknowledged a possible recession but claimed his policies would drive a boom in the US, distancing current economic trends from former US President Biden's legacy.
While there are signs of market resilience, like recent stock market gains and better-than-expected US employment numbers in April, suggesting the economy is holding up well, economists are still concerned that the ongoing trade policies and tariffs could eventually cause the economy to slow down.
This uncertainty increase means risk-off sentiment in the market, which does not bode well for risky assets like Bitcoin. As the economy weakens, investors could pull back from volatile assets like Bitcoin in favor of safer options like Gold.
Bitcoin holders realize profit and increase selling pressure
Bitcoin's on-chain metrics show that BTC holders are booking some profits, according to Santiments’ Network Realized Profit/Loss (NPL), which computes a daily network-level Return On Investment (ROI) based on the coin’s on-chain transaction volume.
Strong spikes in a coin’s NPL indicate that its holders are, on average, selling their bags at a significant profit. On the other hand, strong dips imply that the coin’s holders are, on average, realizing losses, suggesting panic sell-offs and investor capitulation.
The metric showed multiple spikes last week, indicating that holders are, on average, selling their bags at a significant profit and increasing the selling pressure.
 [14-1746443048242.19.38, 05 May, 2025].png)
BTC NPL chart. Source: Santiment.
However, institutional investors strongly demand Bitcoin despite holders booking a profit. According to SoSoValue data, the US spot Bitcoin Exchange Traded Funds (ETF) recorded a total inflow of $1.81 billion last week after an inflow of $3.06 billion the previous one. If these inflows continue and intensify, Bitcoin prices could rally further.
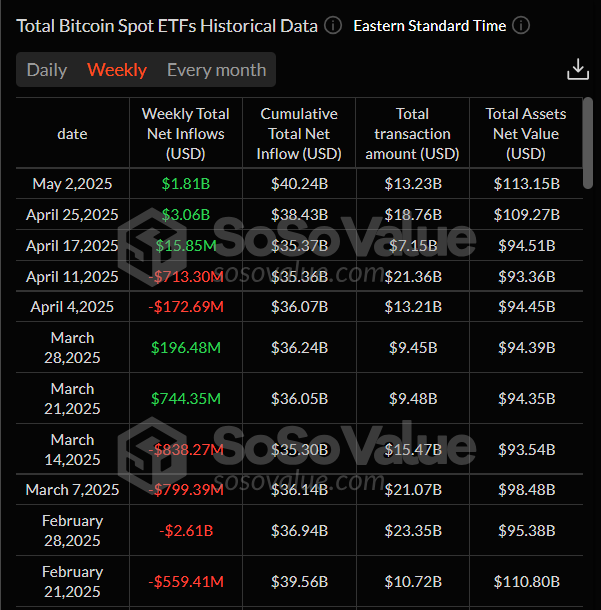
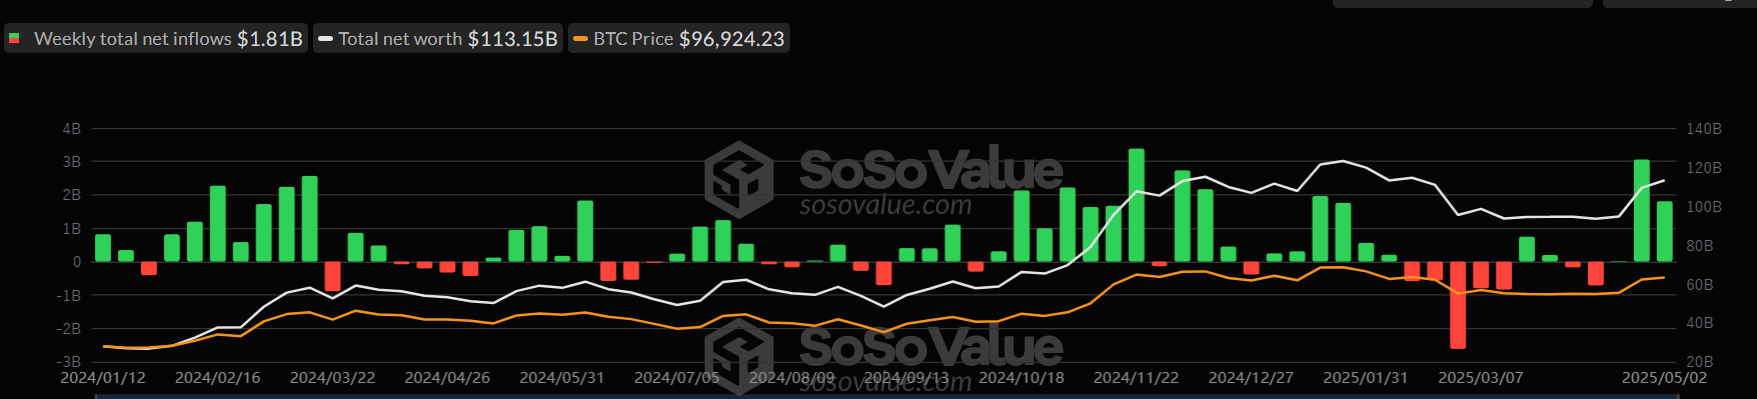
Total Bitcoin Spot ETFs weekly chart. Source: SoSoValue
Bitcoin's technical outlook suggests bearish divergence in the short term
Bitcoin price action on the 4-hour chart shows weakness in the Relative Strength Index (RSI) momentum indicator. The higher high in the BTC price formed on Friday does not reflect the RSI's lower high for the same period. This development is termed a bearish divergence, often leading to a trend reversal or short-term pullback. Moreover, the Awesome Oscillator indicator also moved below its neutral zero on Sunday, suggesting a bearish trend ahead.
If BTC continues its downward move, it could extend the decline to retest the next 4-hour support level of around $92,580.
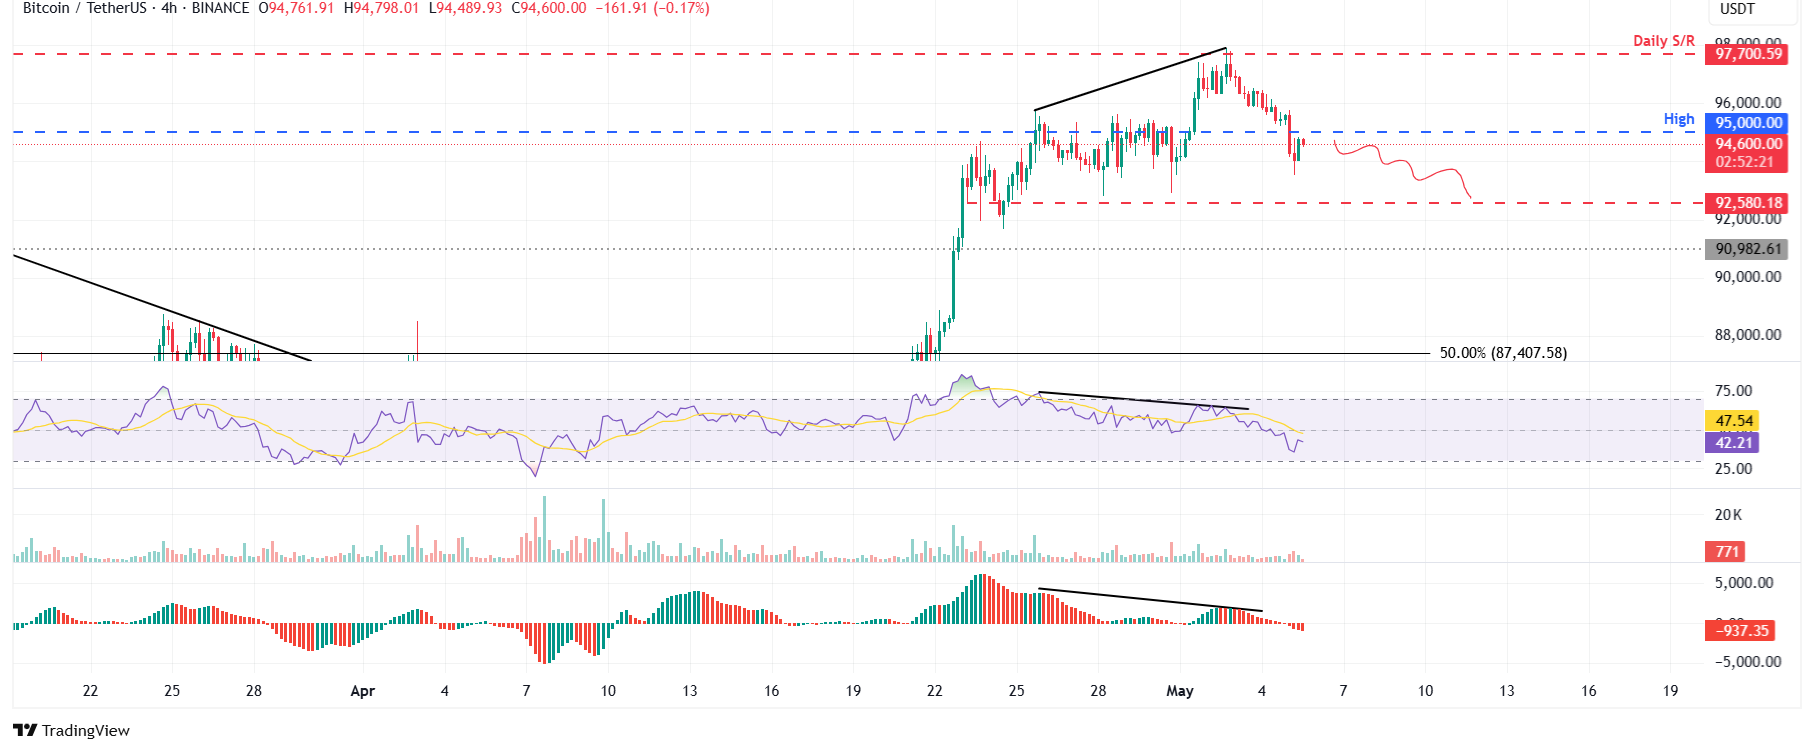
BTC/USDT 4-hour chart
Looking at the daily chart, Bitcoin price retested and was rejected around its daily resistance level of $97,700 on Friday. It then declined nearly 3% over the next two days. At the time of writing on Monday, BTC trades at around $95,000.
If BTC continues to correct, it could extend the decline to retest its next key support level at $90,000.
The RSI on the daily chart reads 60 after being rejected from its overbought level of 70 on Friday, indicating fading bullish momentum. If the RSI slips below its neutral level of 50, it would suggest a bearish momentum and a fall in Bitcoin’s price. Moreover, the Moving Average Convergence Divergence (MACD) is about to flip a bearish crossover, and if it occurs, it would give a selling signal and indicate a downward trend.
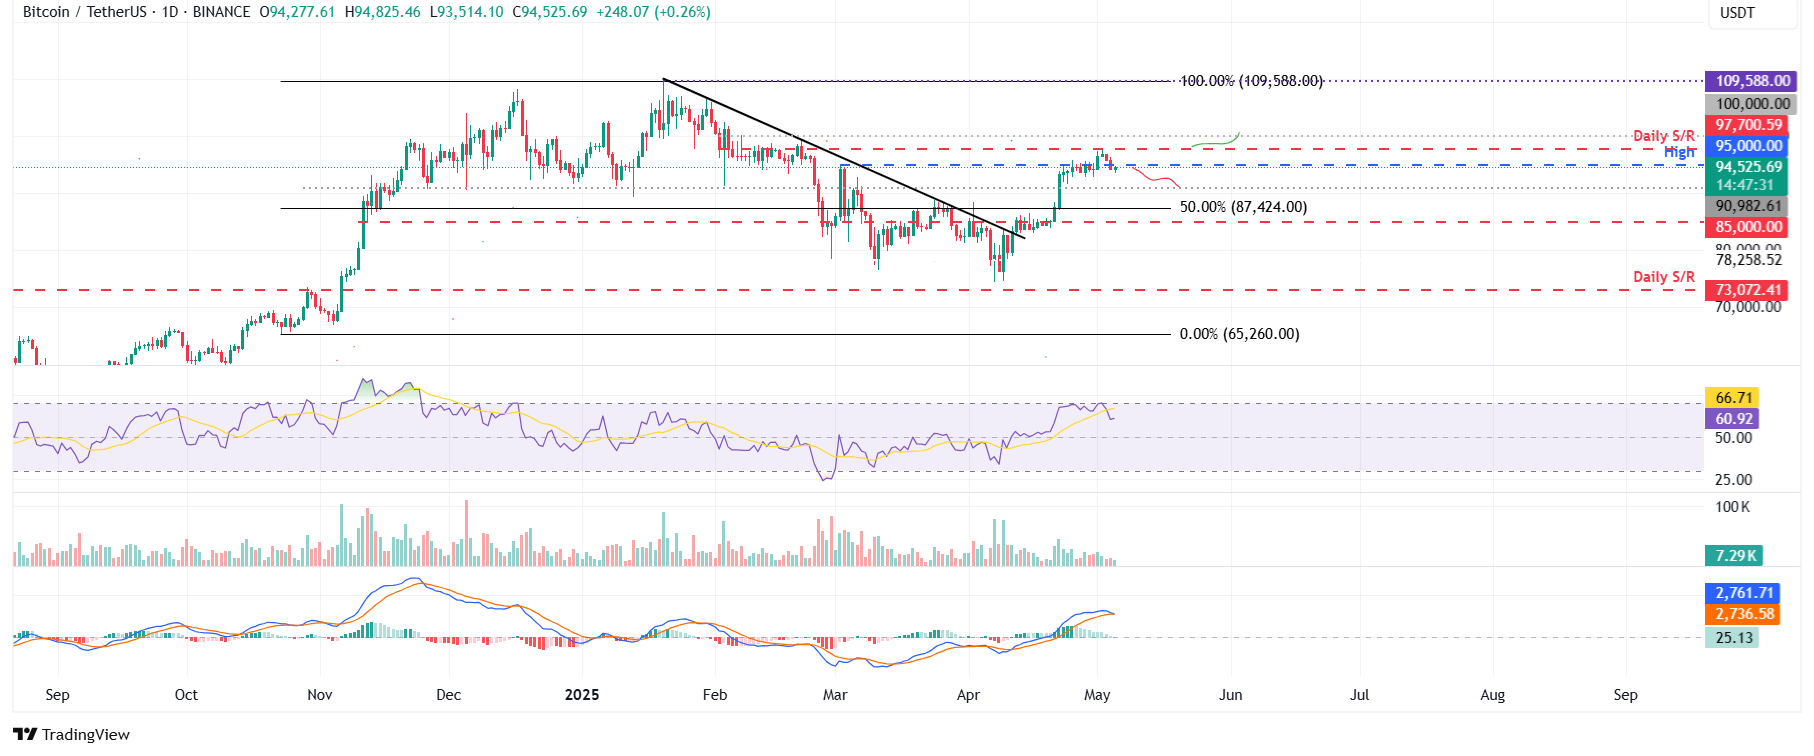
BTC/USDT daily chart
However, if BTC recovers and breaks above its daily resistance at $97,700, it could extend the gains to retest its psychological resistance at $100,000.
Bitcoin, altcoins, stablecoins FAQs
Bitcoin is the largest cryptocurrency by market capitalization, a virtual currency designed to serve as money. This form of payment cannot be controlled by any one person, group, or entity, which eliminates the need for third-party participation during financial transactions.
Altcoins are any cryptocurrency apart from Bitcoin, but some also regard Ethereum as a non-altcoin because it is from these two cryptocurrencies that forking happens. If this is true, then Litecoin is the first altcoin, forked from the Bitcoin protocol and, therefore, an “improved” version of it.
Stablecoins are cryptocurrencies designed to have a stable price, with their value backed by a reserve of the asset it represents. To achieve this, the value of any one stablecoin is pegged to a commodity or financial instrument, such as the US Dollar (USD), with its supply regulated by an algorithm or demand. The main goal of stablecoins is to provide an on/off-ramp for investors willing to trade and invest in cryptocurrencies. Stablecoins also allow investors to store value since cryptocurrencies, in general, are subject to volatility.
Bitcoin dominance is the ratio of Bitcoin's market capitalization to the total market capitalization of all cryptocurrencies combined. It provides a clear picture of Bitcoin’s interest among investors. A high BTC dominance typically happens before and during a bull run, in which investors resort to investing in relatively stable and high market capitalization cryptocurrency like Bitcoin. A drop in BTC dominance usually means that investors are moving their capital and/or profits to altcoins in a quest for higher returns, which usually triggers an explosion of altcoin rallies.
추천 기사


